Benaraby is situated on the southern entrance to Gladstone and is well known to anglers who fish on the Boyne River, or the nearby natural beauty spot of Lake Awoonga. Benaraby is situated along the Bruce Highway and caters to the passing travellers with fuel stations, food outlets and accommodation offerings. Benaraby is home to the community-led Central Queensland Motor Sports Precinct.
Compared to the Gladstone Region and Queensland, Benaraby has:
- The median age of Benaraby is 41 and has increased slightly but is roughly in line with the region and State, being only three years higher.
- Benaraby has a significantly lower cultural diversity when compared to the region and the State.
- There is an increasing number of couple families without children, which is higher than the region but lower than the State by 15 per cent.
- Median household income is significantly higher than both the region and State.
| Data focus |
Benaraby |
|
Gladstone Region |
Queensland |
|
2021 |
2016 |
Change 2021- 2016 |
2021 |
2021 |
| Median age |
41 |
39 |
5.1% |
38 |
38 |
| Non English-Speaking Backgrounds |
1.20% |
1.60% |
-25.0% |
5% |
12.6% |
| Couple Family without children |
45.50% |
39.30% |
15.8% |
41.7% |
55.4% |
| Couple Family withchildren |
49% |
55.80% |
-12.2% |
40.5% |
28.0% |
| Average number of people per household |
3 |
3 |
0.0% |
2.5 |
2.5 |
| Household with a mortgage |
56.1% |
58.30% |
-3.8% |
37.0% |
34.4% |
| Households renting |
7.9% |
5.4% |
46.3% |
33.4% |
33.0% |
| Median weekly household income |
$2,435 |
$2,083 |
16.9% |
$1,639 |
$1,675 |
| Median monthly mortgage repayments |
$2,000 |
$2,383 |
-16.1% |
$1,600 |
$1,733 |
| Median weekly rent (overall) |
$300 |
$250 |
20.0% |
$275 |
$365 |
| University attendance |
9.60% |
4.10% |
134.1% |
7.2% |
14.2% |
In 2021, the population of Benaraby was 1,166. Since 2016, the population of Benaraby has decreased by 53 people.
In 2021, the median age of the Benaraby community was 41, compared to 39 in 2016. This is slightly higher than the region and the State, both of which have a median age of 38.
There have been movements across all age brackets; it is clear to see that there is an ageing population.
The proportion of the population aged 55 and over has increased by 29 per cent when comparing 2021 and 2016, this represents an increase of 76 people.
Two of the largest increases were seen in those aged 55-59 and 60-64. The proportion of the population ages 55-59 increased by 32 per cent between 2021 and 2016. Representing 6.4 per cent (78 people) of the population in 2016 compared to 8.8 per cent in 2021.
While the proportion of those aged 60-64 equally increased by 32 per cent, being 4.8 per cent (59 people) of the population in 206 compared to 6.7 per cent (78 people) in 2021.
The two largest decreases seen were for those aged between 40-44 and 45-49. The number of people aged 45-49 decreased by 36 people between 2021 and 2016, or 26.7 per cent, 135 people in 2016 compared to 99 people.
Likewise, those aged between 40-44 years decreased by 25.5% or 28 people across the five-year period.
Analysing the population age trend provides a view that Benaraby is popular for the over 50 community. Over the course of the Census period, people aged 49 years and below have declined by 14.1 per cent from 856 people in 2016 to 735 in 2021. The over 50 year age group has experienced growth of 16.4% over the same period, with 365 people in 2016 growing to 425 in 2021.
While the population may be transitioning into an over 50s community, people under 49 are still the majority of the community at 64 per cent, with people over 50 years making up the remaining 36 per cent.
In 2021, the age groups that differ most to the Gladstone Region are:
- The percentage of the population that are babies and pre-schoolers are 2.7 per cent higher when compared to the region.
- The percentage of the population that are classed as Tertiary education and independence, Young workforce and Empty nesters and retirees are all 2.5 per cent lower than the region.
- While the number of parents and home builders is decreasing in 2021 it there were 0.8 per cent higher than the region.
- Older workers and retirees make up 16.5 per cent of the Benaraby population which is 2.2 per cent higher than the region.

| Age |
Benaraby |
Gladstone Region |
Queensland |
|
2021 Pop |
% pop |
2016 Pop |
% pop |
% Change 2021 - 2016 |
2021 Pop |
% pop |
2021 Pop |
% pop |
| Median age |
42 |
N/A |
41 |
N/A |
N/A |
38 |
N/A |
38 |
N/A |
| 0-4 years |
60 |
5.15 |
71 |
5.824 |
-15.5% |
4,049 |
6.4 |
292,452 |
5.7 |
| 5-9 years |
90 |
7.72 |
104 |
8.532 |
-13.5% |
4,686 |
7.4 |
329,311 |
6.4 |
| 10-14 years |
103 |
8.83 |
130 |
10.66 |
-20.8% |
4,913 |
7.7 |
342,560 |
6.6 |
| 15-19 years |
94 |
8.06 |
87 |
7.137 |
8.0% |
4,001 |
6.3 |
313,506 |
6.1 |
| 20-24 years |
29 |
2.49 |
29 |
2.379 |
0.0% |
3,159 |
5 |
323,739 |
6.3 |
| 25-29 years |
40 |
3.4 |
41 |
3.4 |
-2.4% |
3,766 |
5.9 |
347,687 |
6.7 |
| 30-34 years |
54 |
4.6 |
70 |
5.7 |
-22.9% |
4,066 |
6.4 |
354,033 |
6.9 |
| 35-39 years |
84 |
7.2 |
79 |
6.5 |
6.3% |
4,280 |
6.7 |
357,120 |
6.9 |
| 40-44 years |
82 |
7 |
110 |
9 |
-25.5% |
4,069 |
6.4 |
330,692 |
6.4 |
| 45-49 years |
99 |
8.5 |
135 |
11.1 |
-26.7% |
4,518 |
7.1 |
340,287 |
6.6 |
| 50-54 years |
89 |
7.6 |
106 |
8.7 |
-16.0% |
4,546 |
7.2 |
333,843 |
6.5 |
| 55-59 years |
103 |
8.8 |
78 |
6.4 |
32.1% |
4,524 |
7.1 |
316,378 |
6.1 |
| 60-64 years |
78 |
6.7 |
59 |
4.8 |
32.2% |
4,154 |
6.5 |
298,919 |
5.8 |
| 65-69 years |
51 |
4.4 |
50 |
4.1 |
2.0% |
3,190 |
5 |
264,515 |
5.1 |
| 70-74 years |
49 |
4.2 |
42 |
3.4 |
16.7% |
2,532 |
4 |
238,952 |
4.6 |
| 75-79 years |
29 |
2.5 |
23 |
1.9 |
26.1% |
1,507 |
2.4 |
168,385 |
3.3 |
| 80-84 years |
19 |
1.6 |
4 |
0.3 |
375.0% |
886 |
1.4 |
106,611 |
2.1 |
| 85 years and over |
7 |
0.6 |
3 |
0.2 |
133.0% |
679 |
1.1 |
97,140 |
1.9 |
| Group |
Age |
Benaraby |
Gladstone Region |
|
|
2021 |
% pop |
2016 |
% pop |
% Change 2016-2021 |
2021 |
% pop |
| Babies and pre-schoolers |
0-4 yrs |
60 |
5.1 |
71 |
5.8 |
-15.5% |
4,049 |
6.4% |
| Primary and secondary schoolers |
5-19 yrs |
287 |
24.6 |
321 |
26.3 |
-10.6% |
13,600 |
28.8% |
| Tertiary education and independence |
20-24 yrs |
29 |
2.5 |
29 |
2.4 |
0.0% |
3,159 |
5.0% |
| Young workforce |
25-29 yrs |
40 |
3.4 |
41 |
3.4 |
-2.4% |
3,766 |
5.9% |
| Parents and home builders |
30-49yrs |
319 |
27.4 |
394 |
32.3 |
-19.0% |
16,933 |
26.6% |
| Older workers and retirees |
50-59 yrs |
192 |
16.5 |
184 |
15.1 |
4.3% |
9,070 |
14.3% |
| Empty nesters and retirees |
60-69 yrs |
129 |
11.1 |
109 |
8.9 |
18.3% |
7,344 |
13.6% |
| Seniors |
70-84 yrs |
97 |
8.3 |
69 |
5.7 |
40.6% |
4,925 |
7.8% |
| Elderly aged |
85+ |
7 |
0.6 |
3 |
0.2 |
133.3% |
679 |
1.1% |
Service group breakdown compared to the Region, source ABS 2022, 2016
The communities of Benaraby have diverse household types with the main group being couples without children.
In 2021, the percentage of couple families with children was 49 per cent which is higher than the region at 41.7 per cent and the State 41.2 per cent.
Couple families with children declined by 8.7 per cent across the five year period, with 183 families in 2016 (55.8% per cent of families), to 167 families in 2021 (49 per cent of families).
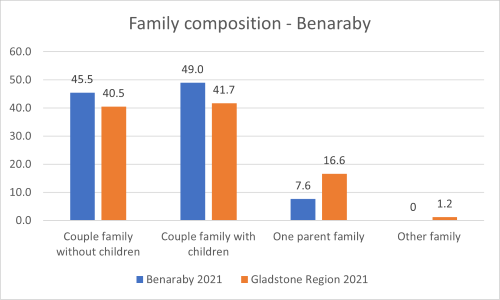
The number of couple families without children has increased between 2016 and 2021 by 20.2 per cent. In 2016, there were 129 families, making up 39.3 per cent of families, while in 2021 there were 155 families without children, making up 45.9 per cent of families.
The most significant increase in the family categories was one parent families, increasing over the Census period by 52.9 per cent. There were 17 one parent families in 2016 compared to 26 in 2021, an increase of nine families.
The number of families in Benaraby increased by 13 between 2021 and 2016.
There are 485 people in a registered marriage in Benaraby, which is 59.1 per cent of the population, which 35.5 per cent higher than the region at 43.6 per cent.
While higher than the region, the number of people in a registered marriage decrease from 509 (63.4 per cent of people) in 2016 to 485 (59.1 per cent) in 2011. The proportion of people in a registered marriage in 2021 was 4.7 per cent lower than in 2016.
The percentage of the population at are not married has seen a minimal decrease from 25.5 per cent in 2016 to 24.9 per cent in 2021, which is a decrease of one person.
The most significant increase in the marital status data, was people in a de-facto marriage, increasing from 91 in 2016 to 127 in 2021, or 39.6 per cent across the five year period.
Considerations:
- There is a need to provide a range of programs and services including for couples without children, families with children and individuals.
- When planning and programmes and activities specific consideration need to be given to the fact there is an increasing number of couple families without children and increasing number of one parent families.
| Benaraby |
Gladstone Region |
Queensland |
|
2021 |
% pop |
2016 |
% pop |
% Change 2016 - 2021 |
2021 pop |
% pop |
2021 pop |
% pop |
| Couple family without children |
155 |
45.5 |
129 |
39.3 |
20.2% |
6,829 |
40.5% |
551,069 |
40.3% |
| Couple family with children |
167 |
49 |
183 |
55.8 |
-8.7% |
7,021 |
41.7% |
563,327 |
41.2% |
| One parent family |
26 |
7.6 |
17 |
5.2 |
52.9% |
2,798 |
16.6% |
124,174 |
9.1% |
source ABS 2022, 2016, 2011
Social Marital Status
| Benaraby |
Gladstone Region |
|
2021 |
% pop |
2016 |
% pop |
% Change 2016 - 2021 |
2021 |
% pop |
| Registered marriage |
485 |
59.1 |
509 |
63.4 |
-4.7% |
20,253 |
43.6% |
| De facto marriage |
127 |
15.5 |
91 |
11.3 |
39.6% |
6,476 |
14.8% |
| Not married |
204 |
24.9 |
205 |
25.5 |
-0.5% |
16,998 |
38.8% |
In 2021, 86.4 per cent of the Benaraby population was born in Australia, compared to 79.6 per cent in the Gladstone Region.
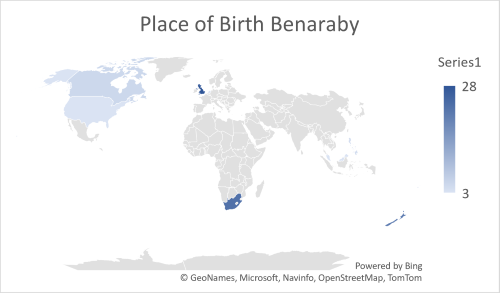
A further 6.9 per cent were born overseas from one other English-speaking country, being Canada, England, New Zealand Scotland, South Africa and the United States of America. A further 3.7 per cent did not state their country of birth.
People from non-English speaking backgrounds make up 1.2 per cent of the Benaraby community, with community members being born in four different Non-English speaking countries.
English was the only language spoken at home for 93.7 per cent of the community. The only other languages spoken at home was Afrikaans at 1.7 per cent of the population or 20 people. Another four people, or 0.3 per cent of the population, spoke another language not listed.
In 2021, there were 43 people that did not state the language spoken at home, equating to 3.7 per cent of the population.
The number and percentage of the population that are Aboriginal and Torres Strait Islander people has increased over the past five years.
In 2021, there were 54 Aboriginal and Torres Strait Islander people living in the Benaraby area, making up 4.6 per cent of the population. While in 2016 there were 32 Aboriginal and Torres Strait Islander people or 2.6 per cent of the population.
The number of Aboriginal and Torres Strait Islander people has increased by 22 people between 2021 and 2016, or by 68 per cent. 4.6 per cent of the Benaraby population identify as Aboriginal and Torres Strait Islander people.
The main religious followings in the Benaraby are:
46.1% - No religion
16.6% - Catholic
15% - Anglican
5.1% - Presbyterian and Reformed
4.% - Uniting Church
2.4% - Christianity, nfd
2.1% - Lutheran
1.7% - Baptist
0.8% - Pentecostal
0.4% - Jehovah's Witnesses
The number of people not aligning with a religion has increased between 2016 and 2021, increasing from 25.8 per cent of the population (315 people) to 46.1 per cent (537 people) in 2021. This equates to a 70.4 per cent increase in the population with no religion.
In 2021, in addition to the 46.1 per cent of the community stating they had no religion, a further 5 per cent did not respond.
This equates to 595 community members either with no religion or unknown and 558 who reported religious affiliation.
The main occupation categories for people aged 15 years and over in Benaraby are:
- 26.9% - Technicians and Trade Operators
- 12% - Professionals
- 11.8% - Machinery operators
- 11% - Clerical and administrative workers
- 10.8% - Managers
- 9.8% - Labourers
The top six occupational categories were the same between 2021 and 2016 just differing slightly in their rank order.

In 2016, the top-ranking categories were; technicians and trades workers (26.9 per cent or 159 People), professionals (12 per cent or 71 people), machinery operators (11.8 per cent or 70 people), Clerical and administrative workers (10.8 per cent or 64 people), Managers (10.8 per cent or 64 people), Labourers (9.8 per cent or 292 people).
The largest increase in occupation categories was in the community and personal service workers segment. The percentage of the workforce in this occupational category increased by 60 per cent between 2021 and 2016. In 2016, 35 people registered as a community and personal service worker, and in 2021, 56 people were employed in this category.
The second highest increase seen as a percentage of population was those working as technicians and trades workers, which represented 22 per cent of the workforce in 2016 compared to 26.9 per cent in 2021. This equates to a 32.5 per cent increased or 39 people.
The largest decrease was seen in clerical and administrative workers which represented 14.1 per cent of the workforce in 2016 or 77 people, this decreased to 10.8 per cent in 2021 or 64 people. Over the period, this category has experienced a 16.8 per cent decline.
The second largest decrease was seen in those working as labourers, making up 12.1 per cent of the workforce in 2016 compared to 9.8 per cent in 2021, a reduction of 12.1 per cent. In 2016, 66 people worked in this occupational category compared to 58 in 2021, a reduction of eight people.
The number of people working full time increased by 21 people between 2021 and 2016. The percentage of the population working full time increased over this period from 39.3 per cent in 2016 to 41.8 per cent in 2021. This equates to a 5.8 per cent increase in the workforce working full time.
Over the same period the number of people that worked part time decreased by one person, from 157 people in 201 to 156 in 2021. This equates to a 0.6 per cent decrease in the proportion of the workforce working part time,
The unemployment rate has decreased in Benaraby between 2016 and 2021. In 2016 the unemployment rate was 6.9 per cent (63 people) compared to 2.8 per cent or 26 people in 2021. The unemployment rate reduced by 58.7 per cent, which means the number of unemployed people decreased by 37.

There has been a 4.9 per cent increase in the percentage of the population not in the workforce between 2016 and 2021, the equivalent of 12 people.
Since 2016 the data has become more accurate with the proportion of people not stating their labour force status decreasing between 2016 and 2021, from 6.6 per cent to 4.2 per cent. A reduction of 36.6 per cent or 22 less people not stating their labour force status.
In 2021, the top five ranked industries were manufacturing at 19.6 per cent, followed by construction at 14.9 per cent. In third was health care and social assistance at 10 per cent. While ranking forth was education and training at 6.8 per cent and fifth was retail trade at 6.4 per cent.
In 2016, the top three ranking industries of employment remained the same as 2021, while ranking fourth was Transport, Postal and Warehousing at 9.6 per cent, in fifth place was health care and social assistance at 7.3 per cent.
In 2011, the top two ranking industries of employment remained the same as in 2021, being manufacturing at 15.6 per cent and construction being 13.6 per cent Ranking third was retail trade at 10 per cent. While in fourth was health care and social assistance at 8.1 per cent, in fifth place was Transport, Postal and Warehousing at 6.8 per cent of the workforce.
The largest decreases at a population level were seen in the Professional, scientific and technical services category, with the number of people decreasing by 17, or 53.1 per cent. Financial and Insurance Services also saw a similar decline, with 50% decrease totaling three people.
The largest increase was seen in accommodation and food services, with an additional 16 people representing an 88.9 per cent increase over the five year period. In 2016, 18 people (3.3 per cent of working population) were employed in this industry and in 2021, 34 people or 5.7 per cent of the population worked in this area.
The second largest increase was in the Public Administration and Safety category, increasing by 61.5 per cent or eight people over the period.

In 2021, 387 people worked more than 35 hours week, compared to 361 people in 2016, an increase of 7.2 per cent.
Those working over 50 hours increased from 23.1 per cent in 2016 to 25.1 per cent in 2021. The number of people in this category increased from 126 to 149, an increase of 23 people or 18.2 per cent.
Data from the 2021 census shows 95.3 per cent of workers travel to their place of work by car, either as driver or passenger.
Considerations:
- There is a large proportion on people working over 35 hours and over a quarter of people working more than 50 hours. Consideration to be given around the accessibility and timing of events, activities and programs.
| Industry |
2021 Pop |
% pop |
2016 Pop |
% pop |
% Change 2016- 2021 |
| Agriculture, Forestry and Fishing |
11 |
1.9 |
17 |
3.1 |
-35.3% |
| Mining |
28 |
4.7 |
18 |
3.3 |
55.6% |
| Manufacturing |
116 |
19.6 |
85 |
15.6 |
36.5% |
| Electricity, Gas, Water and Waste Services |
22 |
3.7 |
25 |
4.6 |
-12.0% |
| Construction |
88 |
14.9 |
74 |
13.6 |
18.9% |
| Wholesale Trade |
12 |
2 |
10 |
1.8 |
20.0% |
| Retail Trade |
38 |
6.4 |
55 |
10.1 |
-30.9% |
| Accommodation and Food Services |
34 |
5.7 |
18 |
3.3 |
88.9% |
| Transport, Postal and Warehousing |
32 |
5.4 |
37 |
6.8 |
-13.5% |
| Financial and Insurance Services |
3 |
0.5 |
6 |
1.1 |
-50.0% |
| Rental, Hiring and Real Estate Services |
6 |
1 |
9 |
1.7 |
-33.3% |
| Professional, Scientific and Technical Services |
15 |
2.5 |
32 |
5.9 |
-53.1% |
| Administrative and Support Services |
12 |
2 |
21 |
3.9 |
-42.9% |
| Public Administration and Safety |
21 |
3.5 |
13 |
2.4 |
61.5% |
| Education and Training |
40 |
6.8 |
41 |
7.5 |
-2.4% |
| Health Care and Social Assistance |
59 |
10 |
44 |
8.1 |
34.1% |
| Other Services |
21 |
0.6 |
25 |
4.6 |
-16.0% |
| Inadequately described/Not stated |
35 |
5.9 |
15 |
2.8 |
133.3% |
Benaraby has a higher socio-economic profile than the Gladstone Region.
- The median weekly household income is $2,435 compared to $1,693 for the Gladstone Region.
- 29 per cent of households earn $3,000 or more per week compared to 25.3 per cent for the Gladstone Region
- 3.7 per cent households earn less than $650 each week compared to 7.2 per cent for Gladstone Region.
- 41.5 per cent of non-family households earn less than $650 each week which is lower than the Region at 47.2 per cent.
Between 2016 and 2021 there has been an increase of the population in the workforce of 7.8 per cent.This equates to an additional 43 people in the workforce in 2021 compared to 2016.
The unemployment rate for Benaraby has significantly decreased by 58.7 per cent between 2016 and 2021. In 2016, 63 people were unemployed, compared to just 26 in 2021.
In 2021 there were 38 people that did not state their labour force status compared to 60 in 2016, a reduction of 36.6 per cent.
In 2021, 33.2 per cent of households fully owned their home which was 21.6 per cent higher than the Gladstone Region at 27.3 per cent. The number of households that owned their home outright was 122 in 2021 and 2016, representing 33.3 per cent and 32.2 per cent of households, respectively.
The population that owns there home with a mortgage decreased by nine household between 2021 and 2016. Decreasing from 58.3% of households to 56.1, which is a reduction of 4.2 per cent.
Median mortgage payments decreased in Benaraby between 2021 and 2016. Average monthly mortgage payments were $2,000 in 2021 which is $400 higher than the Gladstone Region and is in line with the State, which has a median payment of $1,733. In 2016, median mortgage payments were $2,383, reducing by $383 in 2021 to $2,000.
Data has changed in all mortgage payment brackets; with a general trend in a reduction in lower price points and increase in higher price points.
Households with mortgages between $1,000-$1,399 saw the largest increase of 78.5 per cent across the period, with an additional 11 houses in 2021 than that of 2016.
The majority of mortgaged households within Benaraby, 28.2 per cent of the total households, have a mortgage payment of $1,800-$2,399. There has been a 34.8 per cent increase in this category over the Census period.
Mortgaged households paying over $4,000 per month saw a decrease in 42.8 per cent, or six households.
There is a much lower percentage of the population renting in Benaraby compared to the Gladstone Region. In 2021, 7.9 per cent of households rented in Benaraby compared 33.9 per cent in the Gladstone Region.
In 2016, 5.4 per cent of households rented compared to 7.9 per cent in 2021. This saw the number of households renting from 20 to 29. This means a 45 per cent increase in the proportion of households renting between 2021 and 2016.
Rental prices vary, with the most common rental category between $100-$149, representing 26.7 per cent of the rental market.
Weekly rent prices between $350-449 is the second most common representing 23.3 per cent of households.
The highest rental category in Benaraby is $550-$649.
Household Mortgage
|
2021 |
% |
2016 |
% |
% change 2016-2021 |
| $0-$299 |
4 |
1.9 |
7 |
3.3 |
-42.8% |
| $300-$449 |
0 |
0 |
5 |
2.3 |
-100.0% |
| $450-$599 |
0 |
0 |
0 |
0 |
0.0% |
| $600-$799 |
5 |
2.4 |
3 |
1.4 |
66.6% |
| $800-$999 |
7 |
3.4 |
9 |
4.2 |
-22.2% |
| $1,000-$1,399 |
25 |
12.1 |
14 |
6.5 |
78.5% |
| $1,400-$1,799 |
31 |
15.0 |
23 |
10.7 |
34.7% |
| $1,800-$2,399 |
58 |
28.2 |
43 |
20.0 |
34.8% |
| $2,400-$2,999 |
30 |
14.6 |
47 |
21.9 |
-36.1% |
| $3,000-$3,999 |
27 |
13.1 |
44 |
20.5 |
-38.6% |
| $4,000 and over |
8 |
3.9 |
14 |
6.5 |
-42.8% |
Household Rent
|
2021 |
% |
2016 |
% |
| $1-$74 |
0 |
0.0 |
4 |
13.8 |
| $75-$99 |
0 |
0.0 |
0 |
0.0 |
| $100-$149 |
8 |
26.7 |
4 |
13.8 |
| $150-$199 |
3 |
10.0 |
0 |
0.0 |
| $200-$224 |
4 |
13.3 |
3 |
10.3 |
| $225-$274 |
4 |
13.3 |
0 |
0.0 |
| $275-$349 |
5 |
16.7 |
5 |
17.2 |
| $350-$449 |
7 |
23.3 |
10 |
34.5 |
| $450-$549 |
4 |
13.3 |
0 |
0.0 |
| $550-$649 |
3 |
10 |
0 |
0.0 |
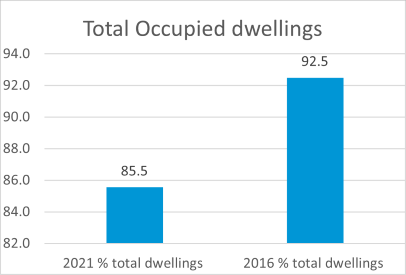
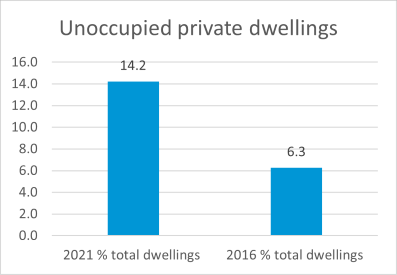
85.5 per cent of dwellings are occupied in Benaraby compared with 85 per cent in the Gladstone Region.
The proportion of occupied dwellings decreased by 0.5 per cent between 2016 and 2021, while the proportion of unoccupied dwelling increased by 144 per cent. There were two less occupied dwelling between 2011 and 2021, while there was an increase of 36 unoccupied dwellings, taking the total to 61.
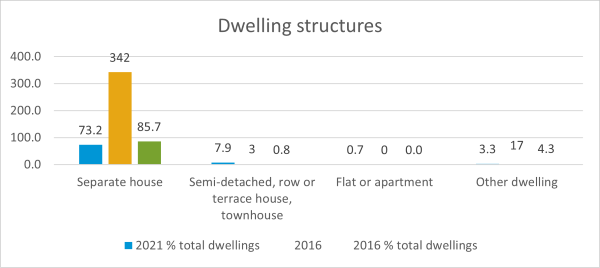
Most of the housing in Benaraby is separate houses at 73.2 per cent which is 0.5 per cent higher than the Gladstone Region. The percentage of properties that are separate houses has decreased by 8.2 per cent since 2016.In 2016, there were 342 separate houses while in 2021 there were 314, a decrease of 23 houses
There has been a significant increase in semi-detached, row or terrace housing across the five years, with an increase of 31 houses in this category between 2016 and 2021.
Considerations:
- There is a sizable number of properties that are unoccupied in Benaraby, which could provide an opportunity to increase availability of housing stock in the current housing challenges across the region.
| Occupancy |
|
2021 % total dwellings |
2016 % total dwellings |
| Total occupied dwellings |
85.5 |
92.5 |
| Unoccupied private dwellings |
14.2 |
6.3 |
4.1% of the community requires assistance with core activities, this represents 248 people.
The number of people requiring assistance with core activities has increased from 31 people to 48 people between 2016 and 2021. This represents a 54.8 per cent increase in the proportion of the community that needed assistance over the Census period.
In addition, the number of people that have 'not stated' need for assistance has decreased over time from 7.9 per cent (96 people) in 2016 to 39 per cent (46 people) in 2021.
The largest proportion of people that required assistance with core activities in 2021 were those aged between 5-14 and those aged 65-74 years old, representing almost 40 per cent of people needing support. Both categories represent 18.8 per cent of those needing support or nine people in each age bracket. For those aged 5-14 the number of people that needed assistance was the same in 2016 as in 2021.
The proportion of people aged 65 and over needing support was 16 per cent in 2016 compared to 43.8 per cent in 2021 an increase of 173.7 per cent or 16 people.
There are 105 people providing unpaid assistance to a person with a disability, health condition or due to old age which in the Benaraby. There has been an increase of 23 people providing unpaid assistance between 2021 and 2016.
The largest proportion of people providing support is those aged 55-64, representing 30.5 per cent of those proving support, which equates to 32 people.
Considerations:
- The age of the population needing support is increasing as is the age of those providing support. Consideration needs to be given to the types of services, programs and activities that are needed.
|
2021 |
% |
2016 |
% |
% change 2016-2021 |
| Has need for assistance 2021 |
48 |
4.1 |
31 |
2.5 |
54.8% |
| Does not have need for assistance 2021 |
1,076 |
92.3 |
1,090 |
89.4 |
-1.3% |
| Need for assistance not stated 2021 |
46 |
3.9 |
96 |
7.9 |
-52.1% |
In Benaraby, volunteering is slightly higher than the Gladstone Region with 153 people (16.8 per cent) aged 15 years and over providing volunteer services. This compares to 16.2 per cent for the Gladstone Region.
The number of volunteers has decreased by 29.8 per cent between 2016 and 2021. In 2016 the number of volunteers was 218 compared to 153 people in 2021.
There have been decreases in the percentage of volunteers that are aged 15–40 across all age brackets between 2016 and 2021. While there were increases for those aged 75 and over.
Council regularly undertakes a Community Satisfaction Survey to identify community sentiment with respect to its assets, services and programs.
|
Benaraby |
Gladstone Region |
LGA Benchmark |
| Overall satisfaction |
56.0% |
55.0% |
55.7% |
|
|
|
|
| ASSETS |
|
|
|
| (1 = very dissatisfied – 100 = very satisfied) |
|
|
|
| Landfills and waste management facilities |
66.2% |
72.9% |
70.2% |
| Public toilets and amenities |
61.4% |
69.1% |
67.7% |
| Airports and aerodromes |
63.5% |
70.8% |
70.1% |
| Performing arts centres |
61.4% |
69.1% |
69.0% |
| Beaches and coastal areas |
66.4% |
73.1% |
73.7% |
| Landscapes and streetscapes |
61.8% |
69.5% |
70.1% |
| Stormwater and flood control system |
57.3% |
65.8% |
67.1% |
| Water and sewerage system |
61.8% |
69.4% |
71.5% |
| Parks and open space |
65.4% |
72.3% |
75.0% |
| Footpaths and cycleways |
56.8% |
65.4% |
68.1% |
| Local roads and bridges |
53.8% |
63.0% |
65.8% |
| Sport and recreation facilities |
61.3% |
69.1% |
73.2% |
| Camping grounds and caravan parks |
55.8% |
64.6% |
68.9% |
| Swimming pools and aquatic centres |
52.5% |
62.0% |
71.5% |
|
|
|
|
| SERVICES |
|
|
|
| (1 = very dissatisfied – 5 = very satisfied) |
|
|
|
| Waste services |
68.1% |
74.5% |
74.0% |
| Customer service |
61.6% |
69.3% |
69.7% |
| Building services |
53.5% |
62.8% |
64.8% |
| Animal management services |
54.5% |
63.6% |
66.1% |
| Informing the community of council decisions |
52.1% |
61.7% |
64.4% |
| Environmental management |
53.6% |
62.8% |
66.4% |
| Making and enforcing local laws |
51.2% |
60.9% |
64.9% |
| Advocating on behalf of the community |
49.9% |
59.9% |
64.2% |
| Making decisions in the best interest of the community |
46.6% |
57.3% |
61.5% |
| Planning and development approval |
47.0% |
57.6% |
62.5% |
| Infrastructure and property services |
49.4% |
59.5% |
64.8% |
| Public health services |
54.8% |
63.8% |
71.0% |
|
|
|
|
| INITIATIVES |
|
|
|
| (1: Far too little – 100: Far too much) |
|
|
|
| Affordable housing development |
40.7% |
52.5% |
49.7% |
| Community safety and crime prevention |
34.8% |
47.9% |
47.5% |
| Creative arts development |
49.2% |
59.3% |
59.2% |
| Festivals and events |
44.9% |
55.9% |
56.8% |
| Business development and support |
43.1% |
54.5% |
55.4% |
| Heritage conservation |
42.2% |
53.7% |
55.1% |
| Tourism development and promotion |
45.1% |
56.1% |
57.3% |
| Opportunities for people of all abilities to participate in community life |
40.4% |
52.3% |
53.9% |
| Grants and support for sports clubs and community organisations |
45.0% |
56.0% |
57.9% |
| Environmental conservation and climate change action |
43.7% |
55.0% |
56.8% |
| Waste minimisation and recycling |
40.3% |
52.2% |
54.4% |
| Childcare |
42.7% |
54.1% |
57.6% |
| Skill development and networking opportunity |
38.6% |
50.9% |
54.5% |
| Health promotion |
40.3% |
52.3% |
55.8% |
| Newcomer attraction and retention |
39.0% |
51.8% |
55.6% |
| Aged care and accommodation |
26.6% |
41.3% |
50.3% |
Customer Service Requests
The community of Benaraby engaged with Council on the following top 20 customer service requests from 30 June 2021 to 1 July 2022:
| Customer Service Request Type |
Amount |
| Request to change address / details |
21 |
| Development services enquiries |
16 |
| Roaming / Straying Dog or Cat |
11 |
| Animal Noise Nuisance - Includes Caged Birds |
10 |
| Leak on Footpath / Road |
8 |
| Repair / Replacement of Wheelie Bin Request |
8 |
| Animal Cancel registration |
7 |
| Missed Wheelie Bin / Collection Problem |
5 |
| Waste Admin Haulage for Transfer Stations |
5 |
| Animal Registration Enquiry / Compliance Matter |
4 |
| Building & Plumbing Compliance |
4 |
| New Initial / Additional Kerbside Collection Levy |
4 |
| New Rural Street Address and Replacement Marker |
4 |
| Overgrown Land - Roadside Slashing |
3 |
| Planning Compliance |
3 |
| Wild/Pest Animal & 1080 (Dingo/Rabbit/Deer/Pig) |
3 |
| Attack / Dangerous / Menacing Dog Incident |
2 |
| Collection of Found / Privately Impounded Animal |
2 |
| Debris on Road -tree/object/non toxi liquid/sharps |
2 |
| Drainage,Kerb,Channelling,Pipes,Gully Pits, Drains |
2 |
| Gravel Road Repair (corrugations/stones/ruts/dust) |
2 |
| Hydrant and Other Water Infrastructure Defects |
2 |
| Parks Maintenance Enquiries and Requests |
2 |
| Water Meter Enquiry/Issues/Reading |
2 |
Rating Arrears
The Benaraby socio-economic position is higher than the Gladstone Region.The median weekly household income for Benaraby is $2,435 compared to $1,693 for the Gladstone Region. With 416 rateable residential properties and 41 commercial properties within the township.
Benaraby had with 14 residential properties in arrears as at 30 October 2022 this equated to 3.4 per cent of residential properties. This is a 66 per cent decrease than at 30 June 2022 when there were 42 properties in arrears.
There were four rateable commercial properties in arrears at 30 June 2022 which was 4.7 per cent of rateable properties. This number decreased to zero as 30 October 2022.
The total rateable residential properties in Gladstone is 13,008. On average, 15.4 per cent of households have outstanding rate payments.
Education
Benaraby State School
Prep – Year 6
Co-educational
108 Students
Community Facilities
Benaraby Progress Assoc. Hall
48845 Bruce Highway
Old time and new vogue dances on Friday night at the hall. All welcome, supper included in the cover charge. Meet 3rd Thursday of the month. Hall available for hire (no private parties), phone the hall convener.
Benaraby Driver Education Facility
160 Jono Porter Way
Delivers low risk defensive driver awareness programs to the Community in Central Queensland.
Camp Akuna Pikes Crossing
191 Pikes Crossing Roads
The camp has been set up as a youth-oriented facility that welcomes travelers and regional people. All proceeds go towards running costs and improving facilities. We have an on-site caretaker (LES) for maintaining the property.
Community Groups
Sporting groups
Community-led Events
- Drift Event
- Drags – CQDRA Champions
- Drags -Off Street Meet
- Benaraby Twilight Fair
- Lake Awonga Adventure Race
- Community-Wide Garage Sale
- Christmas Ham Wheel
- Benaraby State School Fair
- Old Time Dancers
- Night Under the Stars Charity Ball
Parks
Sport & Recreation