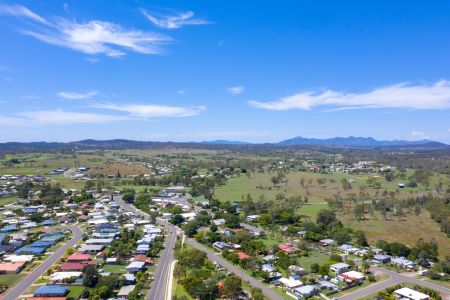
 A short drive from Gladstone you find the semi-rural community of Calliope, famed for its historical homesteads, horse riding trails and native bushland. The area is home to a number of community-led events and activities, such as the annual Calliope Rodeo and the Calliope Historical Village markets held six times per year.
Observations
- The median age of Calliope is 32 and has remained roughly static between 2011 and 2021. The median age is six years younger than the region and State.
- Calliope has limited cultural diversity when compared to the region and the State
- There is a sizeable number of couple families with children, 49.2 per cent, when compared to the region.
- Median household income is higher than both the region and State.
Compared to the Gladstone Region and Queensland, Calliope has:
| Data focus |
Boyne Tannum |
|
|
|
Gladstone Region |
Queensland |
|
2021 |
2016 |
2011 |
Change 2021- 2011 |
Change 2021- 2016 |
Change 2016- 2011 |
2021 |
2021 |
| Median Age |
32 |
31 |
32 |
0.0% |
3.2% |
-3.1% |
38 |
38 |
| Non English-speaking backgrounds |
1.6% |
1.5% |
1.2% |
33.3% |
6.7% |
25.0% |
5% |
12.6% |
| Couple Family with children |
49.2% |
50.0% |
53.7% |
-8.4% |
-1.6% |
-6.9% |
41.7% |
55.4% |
| Couple Family without children |
34.8% |
35.7% |
36.2% |
-3.9% |
-2.5% |
-1.4% |
40.5% |
28% |
| Average number of people per household |
2.9 |
2.9 |
2.9 |
0.0% |
0.0% |
0.0% |
2.5 |
2.5 |
| Household with a mortgage |
43.6% |
46.0% |
49.1% |
-11.2% |
-5.2% |
-6.3% |
37% |
34.4% |
| Households renting |
28.7% |
30.1% |
19.0% |
51.1% |
-4.7% |
58.4% |
33.4% |
33% |
| Median weekly household income |
$1,884 |
$1,803 |
$1,947 |
-3.2% |
4.5% |
-7.4% |
$1,639 |
$1,675 |
| Median monthly mortgage repayments |
$1,733 |
$2,100 |
$2,167 |
-20.0% |
-17.5% |
-3.1% |
$1,600 |
$1,733 |
| Median weekly rent (overall) |
$300 |
$250 |
$350 |
-14.3% |
20.0% |
-28.6% |
$275 |
$365 |
| University attendance |
6% |
5.5% |
4.9% |
22.4% |
9.1% |
12.2% |
7.2% |
14.2% |
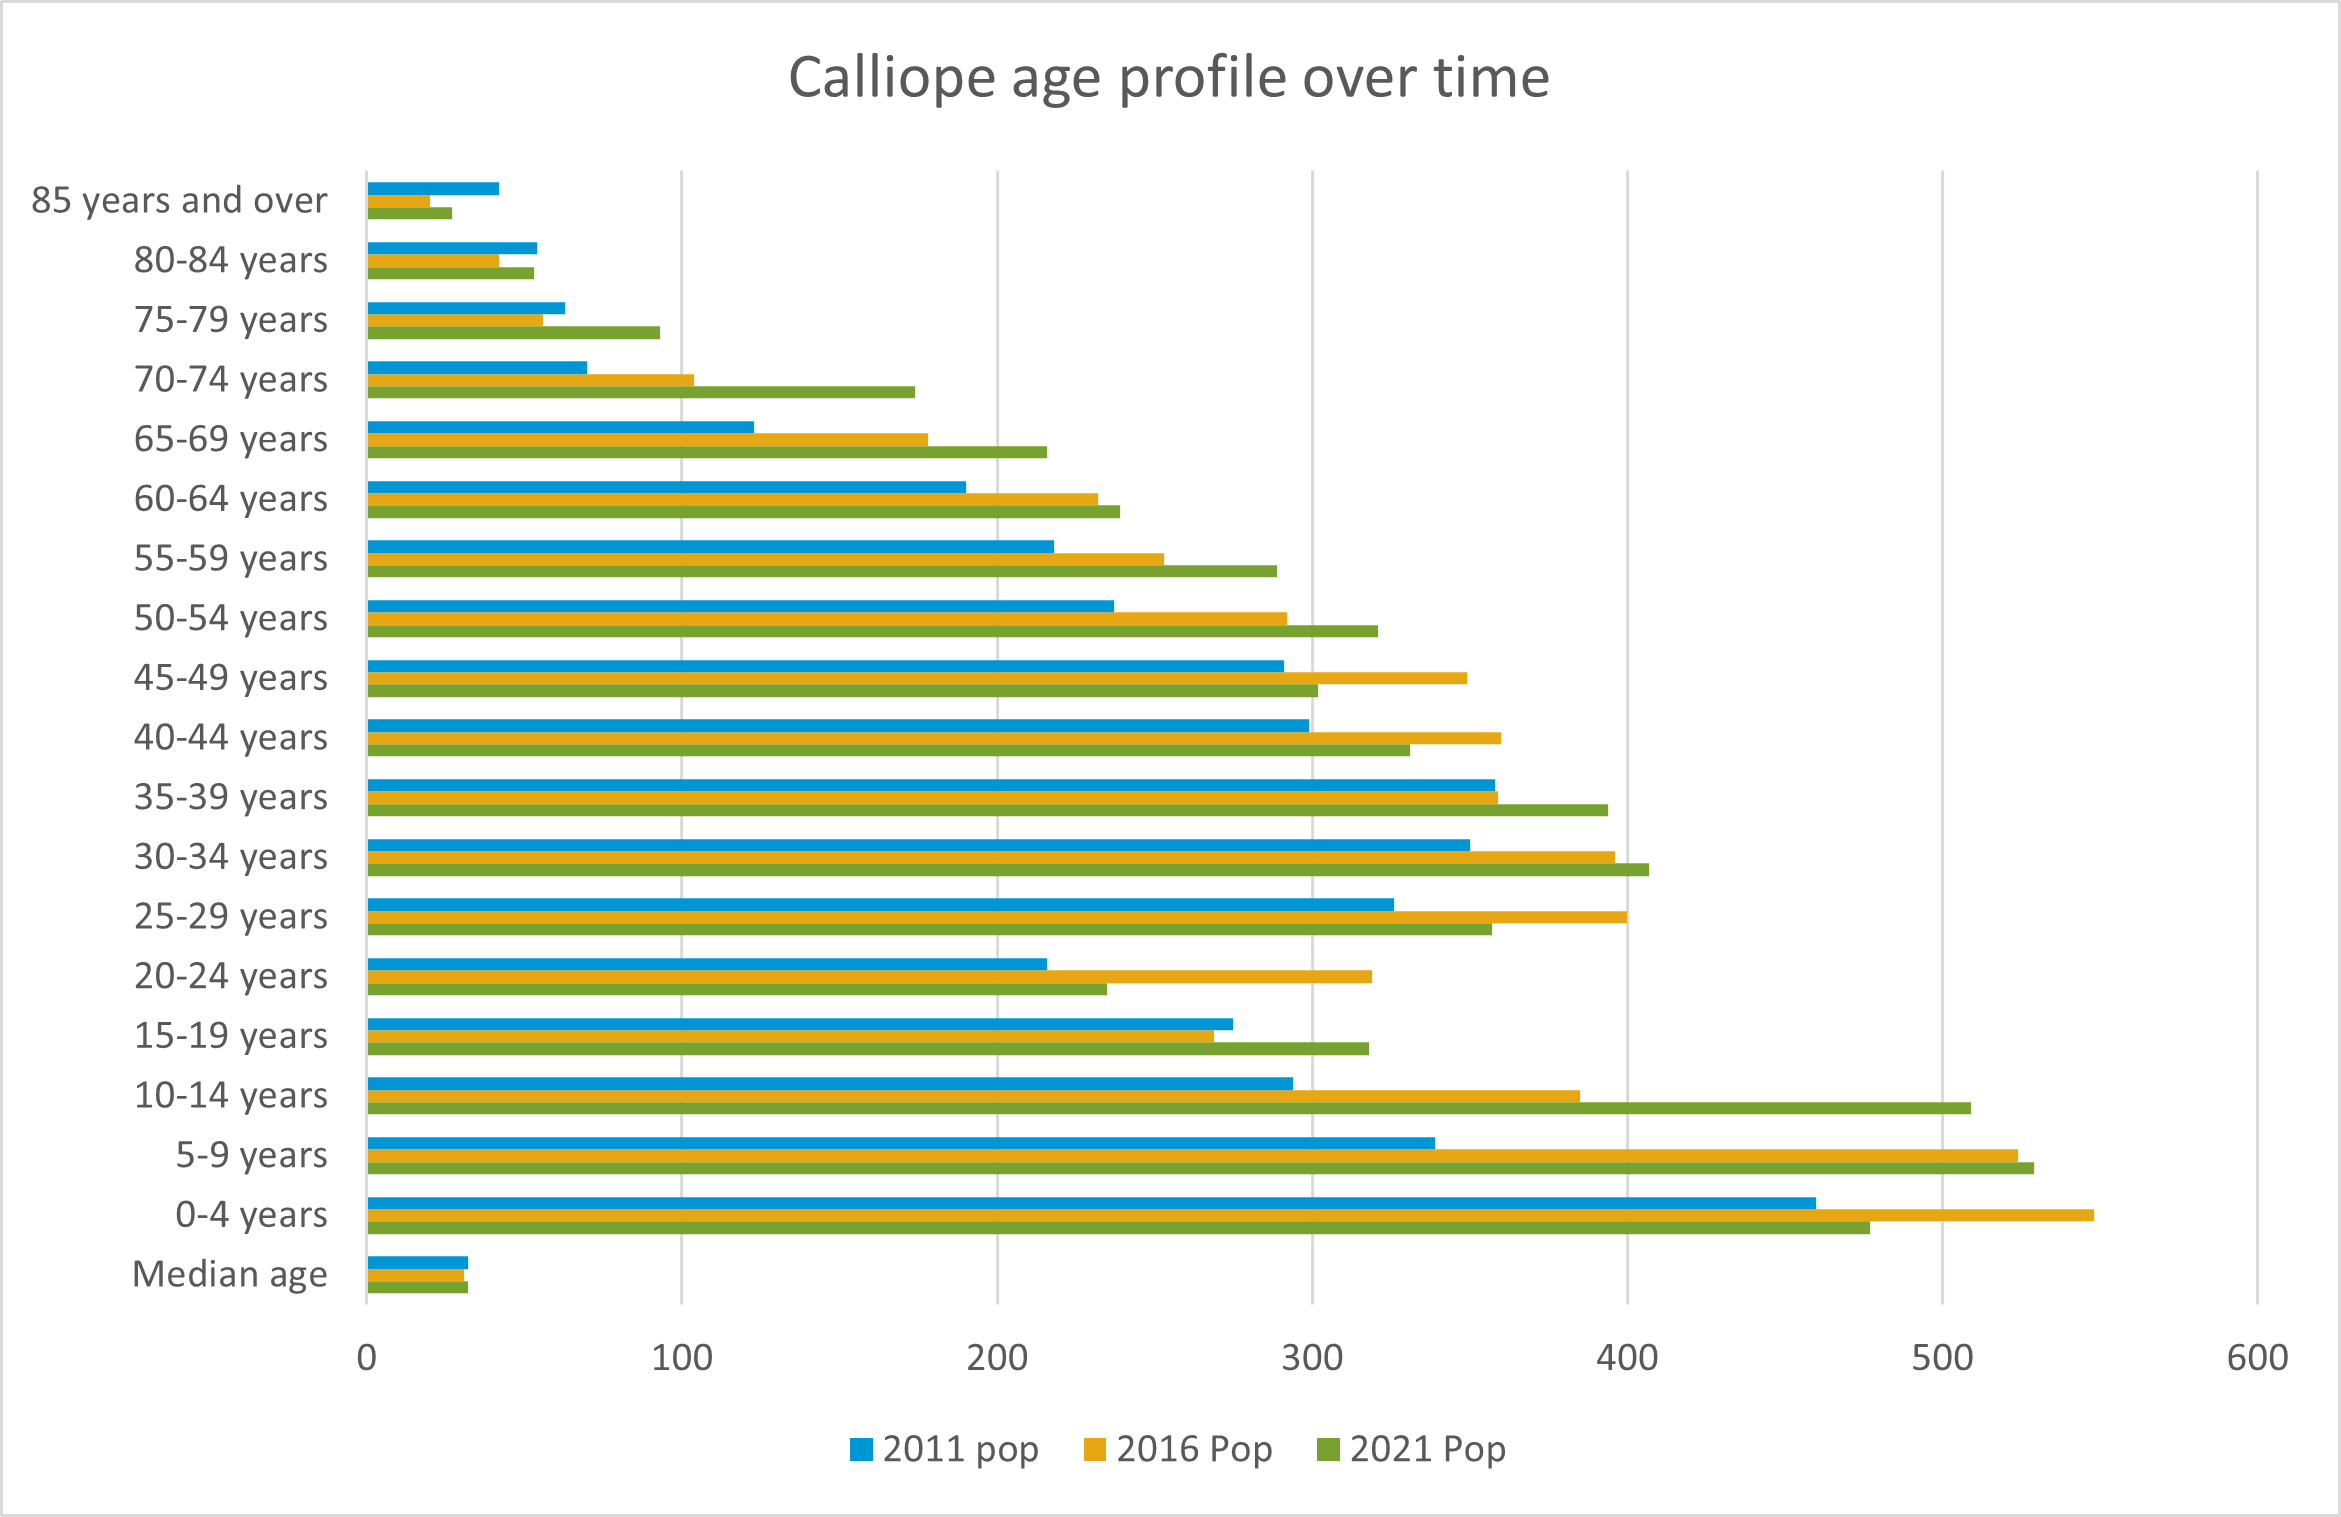
In 2021, the population of Calliope was 5,263, an increase of 1,057 people across the 10-year Census period.
Calliope boasts a younger median age than that of the Gladstone Region. There has been little movement across the three census dates, with an average age of 32, in comparison to the region and State average of 38.
With most age categories increasing during the census period with the associated population growth, there are two particular categories that have seen more pronounced increases, young people and retirees.
Young people aged between five to nine, have seen a 56 per cent increase since the 2011 Census, a population change of 190 people. Similarly, there has been a 73 per cent increase in young people aged 10-14, 215 people across the decade.
At the other end of the age spectrum, significant increases were also recorded in the retiree segment, with a 75.6 per cent increase in 65-69 ages, or 93 people. An additional 104 people were also recorded in the 70-74 age category, which is an increase of 148.6 per cent across the decade.
The 2021 Census also shows a rapid decline in population over 85 years, with a decrease of 35.7 per cent.
In 2021 the age groups that differ most to the Gladstone Region are:
- The percentage of the population that are babies and pre-schoolers are 2.7 per cent higher when compared to the region.
- The percentage of the population that are Primary and Secondary schoolers is increasing but still lower than the region by 3 per cent.
- The percentage of the population that are older workers and retirees, empty nesters and seniors is increasing in Calliope but is still lower than the region by 10 per cent.
| Age |
Calliope |
Gladstone |
Region |
Queensland |
|
|
2021 Pop |
% pop |
2016 Pop |
% pop |
2011 pop |
% pop |
% Change 2011- 2021 |
% Change 2016- 2021 |
% Change 2011- 2016 |
2021 Pop |
% pop |
2021 Pop |
% pop |
| Median age |
32 |
N/A |
31 |
-- |
32 |
NA |
NA |
NA |
|
38 |
N/A |
38 |
N/A |
| 0-4 years |
477 |
9.1 |
548 |
10.7 |
460 |
10.9 |
3.7% |
-13.0% |
19.1% |
4,049 |
6.4 |
292,452 |
5.7 |
| 5-9 years |
529 |
10.1 |
524 |
10.3 |
339 |
8.1 |
56.0% |
1.0% |
54.6% |
4,686 |
7.4 |
329,311 |
6.4 |
| 10-14 years |
509 |
9.67 |
385 |
7.5 |
294 |
7 |
73,1% |
32.2% |
31.0% |
4,913 |
7.7 |
342,560 |
6.6 |
| 15-19 years |
318 |
6.04 |
269 |
5.3 |
275 |
6.5 |
15.6% |
18.2% |
-2.2% |
4,001 |
6.3 |
313,506 |
6.1 |
| 20-24 years |
235 |
4.47 |
319 |
6.3 |
216 |
5.1 |
8.8% |
-26.3% |
47.7% |
3,159 |
5 |
323,739 |
6.3 |
| 25-29 years |
357 |
6.8 |
400 |
7.8 |
326 |
7.8 |
9.5% |
-10.8% |
22.7% |
3,766 |
5.9 |
347,687 |
6.7 |
| 30-34 years |
407 |
7.7 |
396 |
7.8 |
350 |
8.3 |
16.3% |
2.8% |
13,1% |
4,066 |
6.4 |
354,033 |
6.9 |
| 35-39 years |
394 |
7.5 |
359 |
7 |
358 |
8.5 |
10.1% |
9.7% |
0.3% |
4,280 |
6.7 |
357,120 |
6.9 |
| 40-44 years |
331 |
6.3 |
360 |
7.1 |
299 |
7.1 |
10.7% |
-8.1% |
20,4% |
4,069 |
6.4 |
330,692 |
6.4 |
| 45-49 years |
302 |
5.7 |
349 |
6.8 |
291 |
6.9 |
3.8% |
-13.5% |
19.9% |
4,158 |
6.5 |
340,287 |
6.6 |
| 50-54 years |
321 |
6.1 |
292 |
5.7 |
237 |
5.6 |
35.4% |
9.9% |
23.2% |
4,546 |
7.2 |
333,843 |
6.5 |
| 55-59 years |
289 |
5.5 |
253 |
5 |
218 |
5.2 |
32.6% |
14.2% |
16.1% |
4,524 |
7.1 |
316,378 |
6.1 |
| 60-64 years |
239 |
4.5 |
232 |
4.5 |
190 |
4.5 |
25.8% |
3.0% |
22.1% |
4,154 |
6.5 |
298,919 |
5.8 |
| 65-69 years |
216 |
4.1 |
178 |
3.5 |
123 |
2.9 |
75.6% |
21.3% |
44.7% |
3,190 |
5 |
264,515 |
5.1 |
| 70-74 years |
174 |
3.3 |
104 |
2 |
70 |
1.7 |
148.6% |
67.3% |
48.6% |
2,532 |
4 |
238,952 |
4.6 |
| 75-79 years |
93 |
1.8 |
56 |
1.1 |
63 |
1.5 |
47.6% |
66.1% |
-11.1% |
1,507 |
2.4 |
168,385 |
3.3 |
| 80-84 years |
53 |
1 |
42 |
0.8 |
54 |
1.3 |
-1.9% |
26.2% |
-22.2% |
886 |
1.4 |
106,611 |
2.1 |
| 85 years and over |
27 |
0.5 |
20 |
0.4 |
42 |
1 |
-35.7% |
35.0% |
-52.4% |
677 |
1.1 |
98,135 |
1.9 |
Service group breakdown compared to the Region, source ABS 2021, 2016, 2011
| Group |
Age |
Calliope |
Gladstone Region |
|
|
2021 |
% pop |
2016 |
% pop |
2011 |
% pop |
% Change 2021- 2011 |
% Change 2021- 2016 |
% Change 2016- 2011 |
2021 |
% pop |
| Babies and pre-schoolers |
0-4 yrs |
477 |
9.1 |
548 |
10.7 |
460 |
10.9 |
3.7% |
-13.0% |
19.1% |
4,049 |
6.4% |
| Primary and secondary schoolers |
5-19 yrs |
1,356 |
25.6 |
1,178 |
23.1 |
908 |
21.6 |
49.3% |
15.1% |
29.7% |
13,600 |
28.8% |
| Tertiary education and independence |
20-24 yrs |
235 |
4.5 |
319 |
6.3 |
216 |
5.1 |
8.8% |
-26.3% |
47.7% |
3,159 |
5.0% |
| Young workforce |
25-29 yrs |
357 |
6.8 |
400 |
7.8 |
326 |
7.8 |
9.5% |
-10.8% |
22.7% |
3,766 |
5.9% |
| Parents and home builders |
30-49yrs |
1,434 |
27.2 |
1,464 |
28.7 |
1,298 |
30.9 |
10.5% |
-2.0% |
12.8% |
16,933 |
26.6% |
| Older workers and retirees |
50-59 yrs. |
610 |
11.6 |
545 |
10.7 |
455 |
10.8 |
34.1% |
11.9% |
19.8% |
9,070 |
14.3% |
| Empty nesters and retirees |
60-69 yrs |
455 |
8.6 |
410 |
8 |
313 |
7.4 |
45.4% |
11.0% |
31.0% |
7,344 |
13.6% |
| Seniors |
70-84 yrs |
320 |
6.1 |
202 |
4 |
187 |
4.4 |
71.1% |
58.4% |
8.0% |
4,925 |
7.8% |
| Elderly aged |
85+ |
27 |
0.5 |
20 |
0.4 |
42 |
1 |
-35.7% |
35.0% |
-52.4% |
679 |
1.1% |
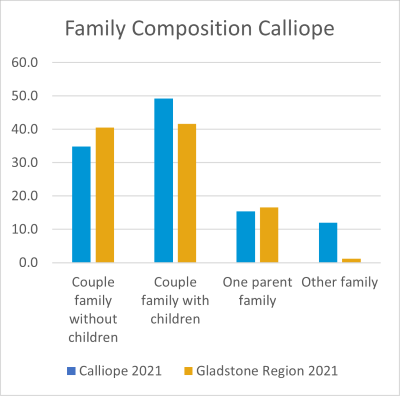
The communities of Calliope have diverse household types with the main group being couples with children.
In 2021, the percentage of couple families with children was 49.2 per cent which is higher than the Region at 41.7 per cent and the State 41.2 per cent. This is an increase of 16.2 per cent across the three Census periods, which equates to an additional 97 families.
The number of couple families without children has increased over time, while reducing as a percentage of total family types
The number of one parent families has doubled between 2011 and 2021, being 106 families in 2011 compared to 182 in 2016 and 217 in 2021. In 2011, one parent families represented 9.5 per cent of families, increasing to 13.5 per cent in 2016 and 15.4 per cent in 2021. While the proportion of families that are one parent families has increased by 104.7 per cent between 2011 and 2021, this is still marginally lower than the Region by 7.5 per cent.
The number of families in Calliope has increased between 2011 and 2021 by 39.7 per cent, with 1,012 families in 2011 and 1414 in 2021.
There are 1652 people in a registered marriage in Calliope, representing 48.8 per cent of the population. This is 11.9 per cent higher than the regional proportion of 43.6 per cent.
There has been an increase of 9.6 per cent of people in a registered marriage across the decade (1507 in 2011 to 1652 in 2021), as well as an increase in the population proportion of 11.9 per cent in comparison to the Gladstone Region.
The percentage of the population that are not married has increased from 29.3 per cent in 2011 to 29.4 per cent in 2016, and increasing further in 2021 to 33.2 per cent, an overall increase of 318 people. This category is 16.5 per cent below the regional norm.
Similarly, the number of people in a de facto marriage increase from 439 in 2011 to 557 in 2016, increasing to 611 in 2021, or 13.1 per cent. This is 22.2 per cent higher than the region when comparing 2021 data.
Considerations:
Calliope is a suburb that is attractive for young families and has a significantly lower median age than the region at 32 years.
Service planning and infrastructure should consider the priorities for young families, such as:
- health and wellbeing
- lifelong learning
- safe, accessible and inclusive communities.
Health & wellbeing: access to medical and allied health professionals; support services and referral pathways; pedestrian and bike paths, sport and recreation facilities.
Lifelong learning: childcare, long day care, playgroups, primary and secondary schools, input into decision making, training, libraries, adult learning.
Safe, accessible and inclusive communities: community events, acknowledgement of cultures and languages, recreational activities and programs, networking events, accessible spaces and places, diversity of housing.
| Calliope |
Gladstone Region |
Queensland |
|
2021 |
% pop |
2016 |
% pop |
2011 |
% pop |
% Change 2011 - 2021 |
% Change 2016 - 2021 |
% Change 2011 - 2016 |
2021 pop |
% pop |
2021 pop |
% pop |
| Couple family without children |
491 |
34.8 |
480 |
35.7 |
403 |
36.2 |
21.8% |
2.3% |
19.1% |
6,829 |
40.5% |
551,069 |
40.3% |
| Couple family with children |
694 |
49.2 |
673 |
50 |
597 |
53.7 |
16.2% |
3.1% |
12.7% |
7,021 |
41.7% |
563,327 |
41.2% |
| One parent family |
217 |
15.4 |
182 |
13.5 |
106 |
9.5 |
104.7% |
19.2% |
71.7% |
2,798 |
16.6% |
124,174 |
9.1% |
| Other family |
12 |
0.9 |
14 |
1 |
6 |
0.5 |
100.0% |
-14.3% |
133.3% |
202 |
1.2% |
46707 |
3.4% |
source ABS 2021, 2016,2011
Social Marital Status
| Calliope |
Gladstone Region |
|
2021 |
% pop |
2016 |
% pop |
2011 |
% pop |
% Change 2011 - 2021 |
% Change 2016 - 2021 |
% Change 2011 - 2016 |
2021 |
% pop |
| Registered marriage |
1,652 |
48.8 |
1,650 |
52.9 |
1,509 |
54.8 |
9.6% |
0.1% |
9.5% |
20,253 |
43.6% |
| De facto marriage |
611 |
18.1 |
557 |
17.8 |
439 |
16 |
39.2% |
9.7% |
26.9% |
6,476 |
14.8% |
| Not married |
1,123 |
33.2 |
919 |
29.4 |
805 |
29.3 |
39.5% |
22.2% |
14.3% |
16,998 |
38. |
source ABS 2022, 2016, 2011
In 2021, 86.6 per cent of the Calliope population was born in Australia, compared to 79.6 per cent in the Gladstone Region.
- A further 6.6 per cent of the Calliope population were born overseas. Most popular countries were New Zealand, England, Philippines, South Africa and Scotland.
- 6.7 per cent did not state their country of birth.
People from non-English speaking backgrounds make up 4.7 per cent of the Calliope community, with community members being born in 12 different non-English speaking countries.
People from non-English speaking backgrounds make up 1.6 per cent of the Calliope community, with community members being born in 12 different Non-English-speaking countries.
English was the only language spoken at home for 92.1 per cent of the population, with 4.7 per cent speaking a language other than English at home.
Ranking second was Afrikaans, with 21 people speaking this language at home representing 0.4 per cent of languages spoken.
Aboriginal and Torres Strait Islander people representation has continually increased over the period, with the 2021 Census reporting 342 First Nation people living in Calliope, making up 6.4 per cent of the population. There has been a growth of 205 people or a 149.6 per cent increase since 2011 (2011, 137 people; 2016, 232 people).
|
Calliope |
% |
Gladstone |
% |
| Australia |
4560 |
86.6% |
50542 |
79.6% |
| New Zealand |
145 |
2.8% |
1950 |
3.1% |
| England |
86 |
1.6% |
1441 |
2.3% |
| Philippines |
27 |
0.5% |
898 |
1.4% |
| South Africa |
43 |
0.8% |
766 |
1.2% |
The most popular languages used at home are outlined in the following table:
| Language used at home |
Calliope |
% |
Gladstone |
% |
| English Only |
4846 |
92.1 |
55537 |
87.4 |
| Non-english language |
81 |
4.7 |
1735 |
7.5 |
|
|
|
|
|
| Afrikaans |
21 |
0.4 |
419 |
0.7 |
| Filipino |
13 |
0.2 |
329 |
0.5 |
| Spanish |
11 |
0.2 |
155 |
0.2 |
| Croatian |
10 |
0.2 |
|
|
| Tagalog |
9 |
0.2 |
383 |
0.6 |
| Mandarin |
|
|
133 |
0.2 |
The main religious followings in the Calliope are:
- 48.7% - No religion
- 15.9% - Catholic
- 12.8% - Anglican
- 3.2% - Uniting Church
- 3.1% - Presbyterian and Reformed
The number of people with no religious affiliation has seen increases across the three Census periods, with the largest increase seen between 2016 and 2021.
- 2011, 1138 people 27.1 per cent of the population
- 2016, 1523 people, 29.9 per cent of the population
- 2021, 2563 people, 48.7 per cent of the population
In addition to 48.7 per cent of the community stated they had no religion in 2021, a further seven per cent did not respond.

The main occupation categories for people aged 15 years and over in Calliope are:
- 23% - Technicians and Trade Operators
- 15.7% - Machinery Operators and Drivers
- 12.6% - Labourers
- 10.1% - Professionals
- 9.9% - Clerical and Administrative workers
- 9.6% - Community and Personal Service Workers
- 8.5% - Sales workers
- 8.3% - Managers
There have been minor fluctuations across the eight measured employment categories across the three Census periods, mostly due to population growth.
One of the eight categories has seen continued growth, Community and Personal Service Workers, with an increase of 43.7 per cent from 2011 to 2021. The Community and Personal Service Workers field has seen the largest growth of all occupations during the period.
Technicians and Trade Workers and Machinery Operators and Drivers have a higher representation in Calliope that the overall Gladstone Region. Technicians and Trade Workers in Calliope are 23 per cent of the workforce with the Gladstone Region at 20.6 per cent, and Machinery Operators and Drivers are 15.7 per cent against the Gladstone Region percentage of 12.2 per cent.
Employment Type
- Almost 40 per cent of the population of Calliope work full time.
- Significant percentage increase of people working part-time, with a change of 41.5 per cent from 2011 to 2021 (37 people).
- 2.9 per cent of the Calliope population work away for work.
- There has been a significant increase in the unemployment status for Calliope, with the change across the decade of 132.3 per cent. This rate was almost doubled between 2011 and 2016 as the percentage of unemployed at Calliope grew from 2.3 per cent in 2011 to 6.4 per cent in 2016 (163 people, or 229.5 per cent).
- There is also steady growth of people not in the labour force, with a growth of 35.5 per cent between the 2011 and 2021 Census period (284 people).
The main occupation categories for people aged 15 years and over in Calliope are:
- Manufacturing (12.8 per cent pop)
- Construction (12.1 per cent pop)
- Retail Trade (9.2 per cent pop)
- Health Care and Social Assistance (9.1 per cent pop)
- Transport, Postal and Warehousing (8.9 pe rcent pop)
- Administration and Support Services had the highest growth across the decade with an increase of 97.6 per cent (increase of 42 people).
- Professional, Scientific and Technical Services also had significant decline of 48.1 per cent (65 people).
- Other growth areas across the 2011 - 2021 period were; Agriculture, Forestry and Fishing (43.4 per cent and 10 people); Electricity, Gas, Water and Waste Services (60.4 per cent - 29 people - assume growth was related to LNG gas); Education and Training (67.0 per cent and 63 people); Health Care and Social Assistance (58 per cent and 76 people).
 Between the 2016 and 2021 period:
- Mining saw a 46.6 per cent increase (35 people)
- Increase in Health Care and Social Assistance of 32.6 per cent or 51 people
- Decline of 50 per cent in Financial and Insurance Services (11 people)
- Continued decline in Professional, Scientific and Technical Services of 42.1 per cent or 51 people
Between 2011 and 2016
- Increase of 100 per cent in Arts and Recreation Services (9 people)
- Increase of 95.3 per cent in Administrative and Support Services (19 people)
- Increase of 19 people 91.3 per cent in Agriculture, Forestry and Fishing
Fields that have seen consistent growth across the decade are:- Education and Training; Health Care and Social Assistance and Electricity, Gas, Water and Waste Services.
- The majority of the Calliope population work over 50 hours per week (21.8 per cent of the population).
- This is consistent with the hours worked in 2016 as well.
- Reflective of the occupation type with highest occupation type being Trades and Technical Services.
- Second highest hours worked is the 40-44 hours (17.7 per cent of pop). There has been a shift since 2016 with employees working an additional 5 hours per week.
 In 2021, 65.3 per cent of the workforce worked more than 35 hours week which is 0.7 per cent higher than in 2016, this equates to 1457 less people working more than 35 hours.
Those working over 50 hours has remained static at 22 per cent of the workforce in 2021 compared to 23 per cent in 2016.
Industry of employment
The top responses for employees ages over 15 years and over in Calliope:
- 5.4% Aluminium Smelting (123 people)
- 3.6% Other Heavy and Civil Engineering Construction (83 people)
- 3.1% Supermarket and Grocery Stores (70 people)
- 2.9% Alumina Production (66 people)
- 2.7% Local Government Administration (61 people)
Compared to top five responses for Gladstone Region:
- 5.7% Aluminium Smelting (1619 people)
- 3.6% Alumina Production (1039 people)
- 3.2% Other Heavy and Civil Engineering Construction (909 people)
- 3.1% Primary Education (883 people)
- 2.8% Supermarket and Grocery Stores (809 people)
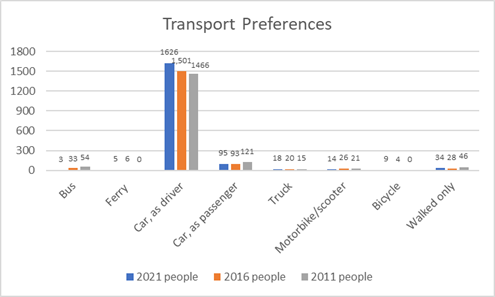
Travel to work
Source: ABS Census 2021, 2016, 2011
- Data from the 2021 census shows 75.4 per cent of workers travel to their place of work by car, either as driver or passenger.
- There has been a significant decrease in workers travelling by bus (94.4 per cent or 51 people) - this could be due to the transport options provided by Bechtel during construction of LNG.
- Increase in employees travelling to work by bicycle.
- An increase from 2016 Census to 2021 Census in people working at home (67.8 per cent or 38 people). Assumption that this is due to COVID-19 and the mandates to work from home.
Considerations
There is a large proportion on people working over 35 hours and almost a quarter of people working more than 50 hours. Consideration to be given around the accessibility and timing of events, activities and programs.
The majority of workers drive to work. Dawson Highway connects Gladstone and Calliope for 23.3km, which is a 21-minute drive. Given travelling by car is the most popular transport option, car pooling could be communicated more prominently to encourage this mode of transport and reduce carbon emissions and costs.
Occupation by Age by Sex (over 15 years)
|
2011 |
% of pop |
2016 |
% of pop |
2021 |
% of pop |
% change (2011-2021) |
2021 Gladstone Region |
% of pop |
| Managers |
153 |
7.3% |
157 |
7.3% |
190 |
8.3% |
24.1% |
2652 |
9.3% |
| Professionals |
189 |
9.1% |
230 |
10.7% |
231 |
10.1% |
22.2% |
4116 |
14.4% |
| Technicians and Trades Workers |
497 |
23.9% |
515 |
24.0% |
526 |
23.0% |
5.8% |
5876 |
20.6% |
| Community and personal services workers |
153 |
7.3% |
193 |
9.0% |
220 |
9.6% |
43.7% |
3086 |
10.8% |
| Clerial and Administrative workers |
232 |
11.1% |
221 |
10.3% |
227 |
9.9% |
-2.1% |
2904 |
10.2% |
| Sales Workers |
171 |
8.2% |
194 |
9.0% |
193 |
8.5% |
12.8% |
2297 |
8.0% |
| Machinery operators and drivers |
367 |
17.6% |
333 |
15.5% |
359 |
15.7% |
-2.1% |
3472 |
12.2% |
| Labourers |
286 |
13.7% |
292 |
13.6% |
287 |
12.6% |
0.3% |
3528 |
12.4% |
Source: ABS Census 2021, 2016, 2011
Calliope has a socio-economic profile slightly higher than the Gladstone Region.
- The median weekly household income is $1,884 compared to $1,693 for the Gladstone Region, and $1,675 for Queensland.
- 25.5 per cent of households earn $3,000 or more per week compared to 25.3 per cent for the Gladstone Region.
- 6.3 per cent households earn less than $650 each week compared to 7.2 per cent for Gladstone Region.
- 49.5 per cent of non-family households earn less than $650 each week which is higher than the region at 47.2 per cent.
Between 2011 and 2021 there has been a 35.5 per cent increase in the percentage of the population not in the workforce. This equates to an additional 284 people not in the workforce in 2021 compared to 2011.
The unemployment rate for Calliope has fluctuated over time, with an overall net increase of 132 per cent between 2011 and 2021, or 94 people.
In 2021 there were 218 people that did not state their labour force status compared to 339 in 2016 and 158 in 2011.
The Socio-Economic Indexes for Australia (SEIFA) index of relative socio-economic disadvantage Australia wide data is ranked from 1 (most disadvantaged) to 1367 (most advanced).
The SEIFA score for Calliope (Suburbs and Localities) 2021 is 966 which is slightly lower than the previous 2016 Census of 986.
The SEIFA score for Gladstone Region in 2016 was 978. Across Australia’s local government areas, SEIFA scores range from 188 (most disadvantaged) to 1186 (least disadvantaged).
In 2021, 17.5 per cent of households fully owned their home which was 35.8 per cent lower than the Gladstone Region at 27.3 per cent. There was a decrease in the proportion of households that own their home between 2021 and 2011. With 24.8 per cent (330 households) owing their home in 2011, compared to 19 per cent (302 homes) in 2016 and 17.5 per cent or 298 homes in 2021.
The population that owns a home with a mortgage increased by 90 households between 2011 and 2021. During the same period the percentage of the population that owned their home with a mortgage decreased, being 49.1 per cent of households in 2011, 46 per cent in 2016 and increasing slightly to 43.6 per cent in 2021.
Median mortgage payments decreased in the Calliope area when comparing 2011 and 2021.
The average monthly mortgage payments in the Calliope were $1,733 in 2021 which is $133 higher than the Gladstone Region and is in line with the State, which has a median payment of $1,733.
In 2011, median mortgage payments were $2,167, reducing by $67 in 2016 to $2100. Payments decreased further between 2021 and 2016, reducing by $367. This resulted in a total reduction in payments of $434.
Whilst the payment data categories between Census periods has changed the biggest two decreases were seen in households paying $3,000-$4,499 and $2,400-$2,999.
Households paying $3,000-$4,499 reduced from 13.5 per cent of households with a mortgage in 2011, to 14.9 per cent in 2016 and 5 per cent in 2021. This is a reduction of 51 households between 2021 and 2011.
Those paying $2,400 -$2,999 represented 7.1 per cent less in 2021 compared to 2021, taking the number of households in this payment bracket from 123 in 2011 to 93 in 2021
The largest increases were seen in those paying $800-$999 (42 households), $1,000-$1,399 (139 households) and $1400-$1799 (125 households).
The number of households paying $1000-$1399, represented 9 per cent of households in 2011, increasing to 10.2 per cent in 2016, with a further increase 18.7 per cent of households in 2021. This equates to an increase of 80 households and an overall increase of 135.5 per cent.
There has been a notable increase in the proportions of households renting in Calliope. In 2011, 18.9 per cent of households rented or 251 households. While in 2016, 30.8 per cent of households rented which represented 490 households. In 2021, household rented maintained at 490 households, representing a slightly lower percentage of overall households at 28.7 per cent.
The most noticeable increase was seen in those renting from a real estate agent, making up 13.7 per cent (182 households) of households in 2011. This amount increased to 25.3 per cent in 2016 (403 households) and slightly lower in 2021 at 21.9 per cent (373 households).
There were reductions across five rental price brackets between 2021 and 2011, 4 pricing categories between $1-$274 per week.
There was an increase across four rental price points, three of which were from $275-$649 a week. The largest increase was seen in those paying $350-$449 a week.
In 2011, 34 households fell into this price bracket, which made up 6.5 per cent of households, this increased to 115 households or 23 per cent of homes in 2021.
The proportion of households paying $275-$349, increased by 57.0 per cent between 2021 and 2011. There were 121 households in this bracket in 2011 and 190 in 2021 which saw people in this price range growing from 23.1 per cent to 38.1 per cent over the decade.
Considerations:
- A significant proportion of non-family households earn less than $650 consideration should be given to the impact this will have on daily life as well as accessibility to programs and events.
- There is a notable increase in the number of people paying more to rent properties in Calliope.
Rental Prices 2021
|
2021 |
% |
2016 |
% |
% change 2016-2021 |
| $1-$74 |
3 |
0.6 |
18 |
3.4 |
-83.3% |
| $75-$99 |
0 |
0 |
0 |
0 |
0.0% |
| $100-$149 |
13 |
2.6 |
13 |
2.5 |
0.0% |
| $150-$199 |
30 |
6 |
51 |
9.8 |
-41.2% |
| $200-$224 |
36 |
7.2 |
129 |
24.7 |
-72.1% |
| $225-$274 |
79 |
15.8 |
135 |
25.8 |
-41.5% |
| $275-$349 |
190 |
38.1 |
121 |
23.1 |
57.0% |
| $350-$449 |
115 |
23 |
34 |
6.5 |
238.2% |
| $450-$549 |
7 |
1.4 |
7 |
1.3 |
0.0% |
| $550-$649 |
4 |
0.8 |
8 |
1.5 |
-50.0% |
| $650-$749 |
0 |
0 |
0 |
0 |
0.0% |
| $750-$849 |
0 |
0 |
0 |
0 |
0.0% |
| $850-$949 |
0 |
0 |
0 |
0 |
0.0% |
| $950 and over |
0 |
0 |
0 |
0 |
0.0% |
| Rent not stated |
23 |
4.6 |
14 |
2.7 |
64.3% |
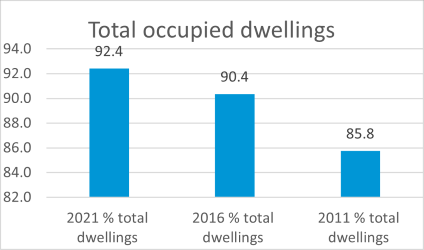
92.4 per cent dwellings are occupied in Calliope compared with 85 per cent in the Gladstone Region.
 The majority of housing in the Calliope area is separate dwelling structures at 87.3 per cent which is 20 per cent higher than the Gladstone Region.
The percentage of properties that are separate houses has increased by 30 per cent since 2011. In 2011, there were 1240 separate houses while in 2016 there were 1514, an increase of 274. The number increased even further in 2021, increasing by 98 homes. This results in a total increase in seperate homes of 372 over the period.
Considerations:
- Calliope has a high occupancy rate of 92.4 per cent of total dwellings. This occupancy rate has maintained post Census.
|
2021 % total dwellings |
2016 % total dwellings |
2011 % total dwellings |
| Total occupied dwellings |
92.4 |
90.4 |
85.8 |
| Unoccupied private dwellings |
7.8 |
9.8 |
8.1 |

4.6 per cent of the community requires assistance with core activities, this represents 241 people.
The number of people requiring assistance with core activities has fluctuated over time. In 2011, 160 people required assistance compared to 150 in 2016 and 241 in 2021. This represents a 50.6 per cent increase in the proportion of the community that needed assistance between 2021 and 2011.
In addition, the number of people that have 'not stated' need for assistance has decreased over time from 5 per cent (212 people) in 2011 to 10.5 per cent (536 people) in 2016 and 5.7 per cent or 300 people in 2021.
The largest proportion of people that required assistance with core activities in 2021 were those aged 5-14 years, making up almost a third of people needing support at 28.2 per cent (68 people). The proportion of people needing assistance in this age bracket increased by a staggering 466 per cent between 2011 and 2021, which is the largest increase across all age brackets. The number of people in this bracket needing assistance increased from 12 in 2011 to 24 in 2016 and 68 in 2021.
The second largest increase was also seen in younger people, the number of people aged 15-19 needing assistance increased from zero in 2011 (0 per cent of those needing assistance) to four (three per cent of those needing assistance), jumping to 18 people or 7.5 per cent in 2021.
The largest decreases were seen in those aged 75-84 and 85 years and older. The proportion of those aged 75-84 decreased from 28.8 per cent of those needing assistance in 2011, to 17 per cent in 2016 to 11.2 per cent in 2021. This is a decrease of 19 people between 2021 and 2011, or 41 per cent.
The second largest decrease was seen in those aged 85 and older, the number of people in this age bracket needing assistance decreased from 37 in 2011 to 2021, representing a decrease of 51 per cent of those needing assistance.
There are 432 people providing unpaid assistance to a person with a disability, health condition or due to old age within Calliope. There has been an increase of 185 people providing unpaid assistance between 2011 and 2021, or 74.8 per cent increase.
The largest proportion of people providing support is those aged 35-44, representing 25.9 per cent of those proving support, which equates to 112 people. The proportion of people in this age bracket providing unpaid assistance has increase by 173 per cent between 2011 and 2021.
The number of people aged 55 over providing unpaid assistance between 2011 and 2021 has increased from 66 to 148, which is an increase of 82 people or 84.4 per cent.
Considerations:
- The age of the population needing support is increasing as is the age of those providing support. Consideration needs to be given to the types of services, programs and activities that are needed, as well as the accessibility requirements that promote inclusion and lifestyle.
- There is a sizeable increase in the number of younger people needing assistance with core activities and an increase in parent age people providing unpaid assistance. Consideration need to be given to specialised service, support and access to venues, parks programs and infrastructure, and events.
|
2021 |
% |
2016 |
% |
2011 |
% |
% change 2011-2021 |
% change 2016-2021 |
% change 2011-2016 |
| Has need for assistance 2021 |
241 |
4.6 |
150 |
2.9 |
160 |
3.8 |
50.6% |
60.7% |
-6.3% |
| Does not have need for assistance 2021 |
4,722 |
89.7 |
4,412 |
86.5 |
3,834 |
91.2 |
23.2% |
7.0% |
15.1% |
| Need for assistance not stated 2021 |
300 |
5.7 |
536 |
10.5 |
212 |
5 |
41.5% |
-44.0% |
152.8% |
Volunteering is lower than the region in Calliope 589 people (15.7 per cent) aged 15 years and over providing volunteer services. This compares to 16.2 per cent for the Gladstone Region.
The number of volunteers has fluctuated over time, in 2011 there was 536 which represented 17.2 per cent of the population. In 2016 the number of volunteers increased significantly to 726 which represented 20 per cent of the community. In 2021 the number of volunteers decreased to roughly the 2011 level with 589 people volunteering which equated to 15.7 per cent of the population.
There are currently nine active community groups in the area, 14 community sporting groups and one large community led event, which is the Calliope Rodeo.
Council regularly undertakes a Community Satisfaction Survey to identify community sentiment with respect to its assets, services and programs.
|
Calliope |
Gladstone Region |
LGA Benchmark |
| Overall satisfaction |
61.0% |
55.0% |
55.7% |
|
|
|
|
| ASSETS |
|
|
|
| (1 = very dissatisfied – 100= very satisfied) |
|
|
|
| Landfills and waste management facilities |
66.2% |
72.9% |
70.2% |
| Art Galleries and museums |
65.9% |
72.7% |
70.7% |
| Public toilets and amenities |
61.4% |
69.1% |
67.7% |
| Libraries |
74.6% |
79.7% |
78.0% |
| Parking facilities and street parking |
57.5% |
66.0% |
65.7% |
| Lighting and signage |
60.4% |
68.3% |
68.9% |
| Beaches and coastal areas |
66.4% |
73.1% |
73.7% |
| Halls and community centres |
63.4% |
70.7% |
72.2% |
| Stormwater and flood control system |
57.3% |
65.8% |
67.1% |
| Water and sewerage system |
61.8% |
69.4% |
71.5% |
| Boat ramps and jetties |
61.0% |
68.8% |
71.0% |
| Parks and open space |
65.4% |
72.3% |
75.0% |
| Footpaths and cycleways |
56.8% |
65.4% |
68.1% |
| Local roads and bridges |
53.8% |
63.0% |
65.8% |
| Sport and recreation facilities |
61.3% |
69.1% |
73.2% |
| Camping grounds and caravan parks |
55.8% |
64.6% |
68.9% |
| Swimming pools and aquatic centres |
52.5% |
62.0% |
71.5% |
|
|
|
|
| SERVICES |
|
|
|
| (1 = very dissatisfied – 100= very satisfied) |
|
|
|
| Emergency and disaster management |
63.8% |
71.0% |
71.0% |
| Waste services |
68.1% |
74.5% |
74.0% |
| Customer service |
61.6% |
69.3% |
69.7% |
| Consulting with the community |
49.7% |
59.7% |
61.1% |
| Animal management services |
54.5% |
63.6% |
66.1% |
| Informing the community of council decisions |
52.1% |
61.7% |
64.4% |
| Financial management |
47.8% |
58.2% |
61.1% |
| Environmental management |
53.6% |
62.8% |
66.4% |
| Making and enforcing local laws |
51.2% |
60.9% |
64.9% |
| Making decisions in the best interest of the community |
46.6% |
57.3% |
61.5% |
| Community services |
55.5% |
64.4% |
69.8% |
| Planning and development approval |
47.0% |
57.6% |
62.5% |
| Infrastructure and property services |
49.4% |
59.5% |
64.8% |
| Public health services |
54.8% |
63.8% |
71.0% |
| Biosecurity and environmental health |
50.1% |
60.1% |
66.8% |
|
|
|
|
| INITIATIVES |
|
|
|
| (1: Far too little – 100: Far too much) |
|
|
|
| Community safety and crime prevention |
34.8% |
47.9% |
47.5% |
| Creative arts development |
49.2% |
59.3% |
59.2% |
| Tourism development and promotion |
45.1% |
56.1% |
57.3% |
| Placemaking to create lively public spaces |
42.9% |
54.3% |
55.9% |
| Opportunities for people of all abilities to participate in community life |
40.4% |
52.3% |
53.9% |
| Grants and support for sports clubs and community organisations |
45.0% |
56.0% |
57.9% |
| Environmental conservation and climate change action |
43.7% |
55.0% |
56.8% |
| Waste minimisation and recycling |
40.3% |
52.2% |
54.4% |
| Children and youth development |
38.3% |
50.6% |
53.6% |
| Skill development and networking opportunity |
38.6% |
50.9% |
54.5% |
| Health promotion |
40.3% |
52.3% |
55.8% |
Natural Disaster
The locality of Calliope is not usually susceptible to flooding, however the possibility of bushfire is present.
Gladstone Entertainment Convention Centre has been identified as the Place of Refuge for this township and is accessible via the Dawson Highway by travelling 24.9km or 23 minutes.
The identified Recovery Hub for Calliope is the Calliope Library and Transaction Centre, Don Cameron Drive.
The township is supported by the local State EmergencyService and Rural Fire Brigade. Queensland Police Service Officer is located within Calliope, as well as Queensland Ambulance Service.
Customer Service Requests
The community of Calliope engaged with Council on the following top 20 topics through customer service requests from 30 June 2021 to 1 July 2022:
| Customer Service Request Type |
|
| Request to change address / details |
80 |
| Development services enquiries |
64 |
| Repair / Replacement of Wheelie Bin Request |
42 |
| Water Meter Enquiry/Issues/Reading |
25 |
| Animal Noise Nuisance - Includes Caged Birds |
23 |
| Overgrown / Unsightly Private Property Complaint |
20 |
| Animal Registration Enquiry / Compliance Matter |
18 |
| SCADA & Radtel Alams System |
18 |
| Leak on Footpath / Road |
17 |
| Manhole & Other Sewer Infrastructure Defects |
15 |
| Overgrown Council Land Requiring Mowing |
15 |
| Illegal Dumping / Littering Report |
13 |
| Animal - Cancel Registration |
11 |
| Building & Plumbing Compliance |
11 |
| New Initial / Additional Kerbside Collection Levy |
11 |
| Roaming / Straying Dog or Cat |
11 |
| Waste Admin Haulage for Transfer Stations |
11 |
| Collection of Found / Privately Impounded Animal |
10 |
| Gravel Road Repair (corrugations/stones/ruts/dust) |
9 |
| Animal - Registration Replacement Tag |
8 |
| Animal - Update Desexing or Microchip Details |
8 |
| Obstruction of Footpath -Vehicle / Boat/ Msg Board |
8 |
| Tree Request and Enquiries on Council Land |
8 |
Rating Arrears
The Calliope’s socio-economic position is slightly higher than the Gladstone Region. The median weekly household income for Calliope is $1,884 compared to $1,693 for the Gladstone Region.
There are 1,998 rateable residential properties and 121 commercial properties.
As at 30 October 2022, Calliope had with 285 residential properties in arrears or 14.3 per cent of residential properties. This figure stayed static between 30 June 2022.
There were nine rateable commercial properties in arrears at 30 June 2022 this number stayed static between 30 June 2022 and 30 October 2022. This means that 7.4 per cent of properties in this category are in arrears.
The total rateable residential properties in Gladstone is 13,008. On average, 15.4 per cent of households have outstanding rate payments.
Education
Calliope State High School
Year 7 – Year 11 (Year 12 in 2024)
Co-educational
439 Students
Calliope State School
Prep – Year 6
Co-educational
620 Students
Community Facilities
Calliope Library and Transaction Centre
3 Don Cameron Drive, Calliope
Features a large function room catering for up to 120 people with a polished timber floor and air conditioning. There is a large heat and serve kitchen and a bar facility, both with servery opening into the function room. The room is also equipped with a permanent projector screen for hirer's use (projector not supplied).
Calliope RSL Hall
32 Stirrat Street, Calliope
The Calliope RSL Hall is a large hall catering for up to 200 people. It has a polished timber floor, ceiling fans and basic kitchen and bar facilities. There is a permanent stage at the rear of the hall with an organ and dressing rooms either side.
Childcare
GoodStart Learning - Calliope
06.15am –6.15pm
Nursery – Kindergarten
Community Groups
- Calliope River Mens Shed
- Calliope Rotary Club
- Calliope Rural Fire Brigade
- Calliope Scout Group
- Calliope State Emergency Services (SES)
- Genealogical Society Gladstone District Inc
- Port Curtis Historical Society Inc
- QCWA Calliope Branch
- Calliope Garden Club Inc
- Calliope Crafty Capers
Sporting Groups
- Calliope and District Campdraft Association
- Calliope and District Cricket Club
- Calliope Central Bowls Club Inc
- Calliope Country Club
- Calliope Crushers Netball Club Inc
- Calliope Football Club
- Calliope Hack and pony Club inc
- Calliope Junior Soccer Club
- Calliope Polocrosse Club
- Calliope Rodeo Association Inc
- Calliope Rooster RLFC (and senior and junior)
- Calliope Sliders Reining Horse Club
- Calliope Soccer Club
- Port Curtis District Mens Bowls Association
Community-led Events
- Calliope Chirstmas Carols
- Calliope Rodeo
- Calliope Rotary Markets
- Calliope Kindergarten Ladies Day
- Rotary Seniors Dinner
- Calliope Race Club
- Boxing Day Races
- Calliope Womens Wellbeing Day
- Bulls Boots and BBQs
- A Long Drive for Drought
- Australia Day Rodeo
Parks
- Bunting Park, Stowe Road, Calliope
- Hazelbrook Park, Morris Avenue, Calliope
- Monterey Way Park, Monterey Way, Calliope
Sport and Recreation
- Bunting Park Skate Park
- Calliope River Camping Grounds
- CK Aquatics Calliope
- Liz Cunningham Park
- Calliope Football Club
- Calliope Golf Club