Baffle Creek, Deepwater and Rules Beach are areas of natural beauty, subtropical tranquillity and fascinating history, with vast pristine waterways, wetlands, coastline.
The area is a patchwork of national parks, conservation parks and state forests. The parks provide habitat of eucalypt forests, subtropical rainforest, dry rainforest and littoral rainforest for a great diversity of wildlife species.
The area is home to a number of community led events, such as the Baffle Creek Family Fishing Competition and the Baffle Creek Car and Bike Muster.
Observations
- The median age in Baffle Creek, Deepwater and Rules Beach has increased slightly when looking at combined data. There are differences at a suburb level, between 2016 and 2021. Median age increased from 56 to 57 for Baffle Creek, while for Deepwater it increased 55 to 57. Rules Beach saw the largest increase from 53 to 60.
- The median age for this area is significantly higher than the Gladstone Region, with a difference of 20 years.
- The areas of Baffle Creek, Deepwater and Rules Beach have significantly lower cultural diversity than the Gladstone Region and the State, with no community members from non-English speaking backgrounds.
- The towns of Baffle Creek, Deepwater and Rules Beach have an increasing proportion of couples without children, which is significantly higher than the region and more than double the State.
- Average data for all areas shows a significantly lower household income when compared to the region and the State.
Compared to the Gladstone Region and Queensland, the towns of Baffle Creek, Deepwater and Rules beach has:
| Data focus |
Baffle Creek, Deepwater and Rules Beach |
|
Gladstone Region |
Queensland |
|
2021 |
2016 |
Change 2021- 2016 |
2021 |
2021 |
| Median age |
58 |
55 |
5.45% |
38 |
38 |
| Non English-Speaking Backgrounds |
0% |
0% |
0% |
5% |
12.6% |
| Couple Family with children |
21.40% |
25.90% |
-17.37% |
41.7% |
55.4% |
| Couple Family without children |
61.0% |
58.10% |
4.9% |
40.5% |
28.0% |
| Average number of people per household |
2 |
1.9 |
5.26% |
2.5 |
2.5 |
| Household with a mortgage |
27.90% |
31.70% |
-11.99% |
37.0% |
34.4% |
| Households renting |
5.00% |
6.80% |
-26.47% |
33.4% |
33.0% |
| Median weekly household income |
$859 |
$729 |
17.83% |
$1,639 |
$1,675 |
| Median monthly mortgage repayments |
$1,121 |
$1,045 |
7.27% |
$1,600 |
$1,733 |
| Median weekly rent (overall) |
$191 |
$109 |
75.23% |
$275 |
$365 |
| University attendance |
3% |
7.70% |
-61.04% |
7.2% |
14.2% |
The data table above has been created using three suburb level data sets. While there are clear trends across the combined data sets these are pronounced or less pronounced at a suburb level. These differences will be highlighted when significant.
In 2021, the towns of Baffle Creek, Deepwater and Rules Beach had a combined population of 498, with 155 people in Baffle Creek, 287 in Deepwater and 56 in Rules Beach.
In 2021 the median age, when looking at the combined data of Baffle Creek, Deepwater and Rules Beach, was 58, compared to 55 in 2016. This is higher than the region and the State, both with a median age of 38. At a suburb level there are differences in the median age.
In Baffle Creek the median age has increased from 56 in 2016 to 57 in 2021.
The median age for Deepwater has increased by a similar amount, from 55 in 2016 to 57 in 2021.
The most notable difference was seen in Rules Beach, where the median age increased from 53 in 2016 to 60 in 2021. Which is 22 years higher than the region and the State.
There have been movements across all age brackets for the combined data, the most notable increases were for those aged 75-79 making up 2.6 per cent (12 people) of the population in 2016, increasing to 5.7 per cent or 29 people in 2021.
The proportion of the population that were aged 15-19 increased from 2 per cent of the population in 2016 to 4.1 per cent in 2021, an increase of 11 people.
While the number of those aged 40-44 increased from 4.6 per cent of the population to 5.3 per cent, representing an increase of six people.
The largest decreases were seen for those aged 0-14, representing 5.9 per cent of the population in 2016, decreasing to 3.4 per cent in 2021, which sees the number of people in this age bracket decrease from 27 to 17.
The number of children aged 0-4 decreased by a similar number, reducing from 17 in 2016 to 6 in 2021 and those aged 5-9 decreasing from 19 to 10 children.
It is clear to see when looking at combined service breakdown for Baffle Creek, Deepwater and Rules Beach that there is an ageing population. Older workers and retirees, empty nesters, seniors and elders represent larger proportion of the community, with an additional 65 people across these service brackets compared to 2016.
In addition to the aforementioned reduction in babies and pre-schoolers, the percentage of population that are parents and homebuilders decreased from 18.4 per cent in 2016 compared to 17 per cent in 2021. Whilst this is a decrease at a population level, it represents an increase of 2 people in this service bracket.
In 2021, the age groups that differ most to the Gladstone Region are:
- The percentage of the population that are primary and secondary schoolers, tertiary education and independent, young workforce, parents and homebuilders are all lower than the region.
- The percentage of the population that are parents and homebuilders is 16.7 per cent lower when compared to the region.
- The percentage of the population that is 50 and over is significantly higher when compared to the region.
- Older workers and retirees make up 26.2 per cent of the Baffle Creek, Deepwater and Rules Beach population, compared to 14.3 per cent for the region.
- Empty nesters and retirees make up 24.5 per cent of the Baffle Creek, Deepwater and Rules Beach population, compared to 13.6 per cent for the region.
- Seniors make up 16.6 per cent of the Baffle Creek, Deepwater and Rules Beach population, compared to 7.8 per cent for the region.
Consideration needs to be given to the ageing population and the reduction in younger members of the community which will mean an increasing demand on services for older community members.

| Age |
Baffle Creek, Deepwater and Rules Beach |
Gladstone Region |
Queensland |
|
2021 Pop |
% pop |
2016 Pop |
% pop |
% Change 2021 - 2016 |
2021 Pop |
% pop |
2021 Pop |
% pop |
| Median age |
- |
N/A |
- |
N/A |
N/A |
38 |
N/A |
38 |
N/A |
| 0-4 years |
6 |
1.2 |
17 |
3.7 |
-64.71% |
4,049 |
6.4 |
292,452 |
5.7 |
| 5-9 years |
10 |
2 |
19 |
4.2 |
-47.37% |
4,686 |
7.4 |
329,311 |
6.4 |
| 10-14 years |
17 |
3.4 |
27 |
5.9 |
-37.04% |
4,913 |
7.7 |
342,560 |
6.6 |
| 15-19 years |
21 |
4.1 |
9 |
2 |
133.33% |
4,001 |
6.3 |
313,506 |
6.1 |
| 20-24 years |
13 |
2.6 |
13 |
2.9 |
0.00% |
3,159 |
5 |
323,739 |
6.3 |
| 25-29 years |
10 |
2 |
8 |
1.8 |
25.0% |
3,766 |
5.9 |
347,687 |
6.7 |
| 30-34 years |
6 |
1.2 |
11 |
2.4 |
-45.45% |
4,066 |
6.4 |
354,033 |
6.9 |
| 35-39 years |
11 |
2.2 |
12 |
2.6 |
-8.33% |
4,280 |
6.7 |
357,120 |
6.9 |
| 40-44 years |
27 |
5.3 |
21 |
4.6 |
28.57% |
4,069 |
6.4 |
330,692 |
6.4 |
| 45-49 years |
42 |
8.3 |
40 |
8.8 |
5.00% |
4,518 |
7.1 |
340,287 |
6.6 |
| 50-54 years |
51 |
10.1 |
44 |
9.6 |
15.91% |
4,546 |
7.2 |
333,843 |
6.5 |
| 55-59 years |
82 |
16.2 |
67 |
14.7 |
22.39% |
4,524 |
7.1 |
316,378 |
6.1 |
| 60-64 years |
70 |
13.8 |
57 |
12.5 |
22.81% |
4,154 |
6.5 |
298,919 |
5.8 |
| 65-69 years |
54 |
10.7 |
47 |
10.3 |
14.89% |
3,190 |
5 |
264,515 |
5.1 |
| 70-74 years |
43 |
8.5 |
42 |
9.2 |
2.38% |
2,532 |
4 |
238,952 |
4.6 |
| 75-79 years |
29 |
5.7 |
12 |
2.6 |
141.67% |
1,507 |
2.4 |
168,385 |
3.3 |
| 80-84 years |
12 |
2.4 |
10 |
2.2 |
20.00% |
886 |
1.4 |
106,611 |
2.1 |
| 85 years and over |
3 |
0.6 |
0 |
0 |
|
679 |
1.1 |
97,140 |
1.9 |
Service group breakdown compared to the Region, source ABS 2021, 2016
| Group |
Age |
Baffle Creek, Deepwater and Rules Beach |
Gladstone Region |
|
|
2021 |
% pop |
2016 |
% pop |
% Change 2016-2021 |
2021 |
% pop |
| Babies and pre-schoolers |
0-4 yrs |
6 |
1.2 |
17 |
3.7 |
-64.71% |
4,049 |
6.4% |
| Primary and secondary schoolers |
5-19 yrs |
48 |
9.5 |
55 |
12.1 |
-12.73% |
13,600 |
28.8% |
| Tertiary education and independence |
20-24 yrs |
13 |
2.6 |
13 |
2.9 |
0.00% |
3,159 |
5.0% |
| Young workforce |
25-29 yrs |
10 |
2 |
8 |
1.8 |
25.00% |
3,766 |
5.9% |
| Parents and home builders |
30-49yrs |
86 |
17 |
84 |
18.4 |
2.38% |
16,933 |
26.6% |
| Older workers and retirees |
50-59 yrs |
133 |
26.2 |
111 |
24.3 |
19.82% |
9,070 |
14.3% |
| Empty nesters and retirees |
60-69 yrs |
124 |
24.5 |
104 |
22.8 |
19.23% |
7,344 |
13.6% |
| Seniors |
70-84 yrs |
84 |
16.6 |
64 |
14 |
31.25% |
4,925 |
7.8% |
| Elderly aged |
85+ |
3 |
0.6 |
0 |
0 |
|
679 |
1.1% |
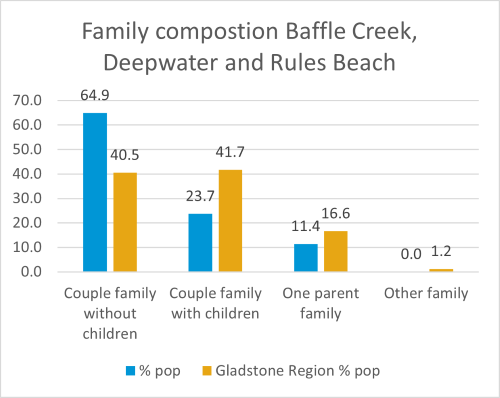
The communities of Baffle Creek, Deepwater and Rules Beach have diverse household types with the main group being couples without children.
When looking at combined data for Baffle Creek, Deepwater and Rules Beach, the percentage of couple families with children, is 23.79 per cent, which is significantly lower than the region at 41.7 per cent and the State at 41.2 per cent.
When reviewing data for each individual community there are even bigger differences in the data. Only 12.5 per cent of families have children in Baffle Creek compared to 25.4 per cent in Deepwater and 26.3 per cent in Rules Reach.
All communities have a higher proportion of couple families without children, when looking at the combined data in Baffle Creek, Deepwater and Rules Beach. Couple families without children make up 64.9 per cent of the population compared to 40.5 per cent for the region.
The number of families has stayed relatively static between 2016 and 2021, the number of families increasing from 111 in 2016 to 114 in 2021.
The number of one parent families is lower than the region and State, however, has increased between 2016 and 2021. In 2016 there were either one parent families, representing 7.2 per cent of families, while in 2021 there were 13 one parent families representing 11.4 per cent of all families. There was a decrease in one parent families in Rules Beach between 2016 and 2021, meaning there are now zero one parent families in Rules beach.
There are 152 people in a registered marriage in Baffle Creek, Deepwater and Rules Beach, which is 41.8 per cent of the population, closely aligned to the region at 43.6 per cent. There has been a 4.8 per cent reduction in the population in a registered marriage between 2016 and 2021.
There has been a notable increase in the percentage of the population that are not married, which was 40.3 per cent of the population in 2016, increasing to 48.1 per cent in 2021, an increase of 46 people.
Considerations:
- With almost two thirds of the population couple families without children and ageing in place, programs and services should reflect health, education, wellbeing and connection.
| Baffle Creek, Deepwater and Rules Beach |
|
2021 |
% pop |
2016 |
% pop |
% Change 2016 - 2021 |
| Couple family without children |
74 |
64.9 |
73 |
65.8 |
1.37% |
| Couple family with children |
27 |
23.7 |
30 |
27 |
-10.0% |
| One parent family |
13 |
11.4 |
8 |
7.2 |
62.50% |
Social Marital Status
| Baffle Creek, Deepwater and Rules Beach |
Gladstone Region |
|
2021 |
% pop |
2016 |
% pop |
% Change 2016 - 2021 |
2021 |
% pop |
| Registered marriage |
152 |
14.8 |
149 |
46.6 |
2.01% |
20,253 |
43.6% |
| De facto marriage |
46 |
12.6 |
44 |
13.8 |
4.55% |
6,476 |
14.8% |
| Not married |
175 |
48.1 |
129 |
40.3 |
35.66% |
16,998 |
38.8% |
In 2021, 83 per cent of the Baffle Creek, Deepwater and Rules Beach population was born in Australia, compared to 79.6 per cent in the Gladstone Region.
A further 6 per cent were born overseas from other English-speaking countries including, England and New Zealand. A further 16.3 per cent did not state their country of birth. This is in addition to 1.4 per cent, or four people who stated they were born elsewhere.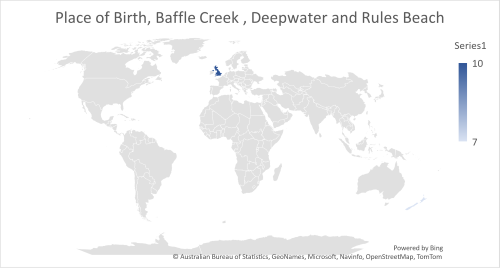
There are 31 Aboriginal and Torres Strait Islander people living in Baffle Creek and Deepwater which is 6.2 per cent of the population.
There were no Aboriginal and Torres Strait Islander people living in Rules Beach, in 2021 or 2016.
When looking at Baffle Creek and Deepwater in isolation there has been a notable change in the Aboriginal and Torres Strait Islander community. In 2016 there were 13 community members living in Baffle Creek, this decreased to eight in 2021. While in Deepwater there were three community members in 2016, increasing to 23 in 2021.
The combined data shows Aboriginal and Torres Strait Islander people made up 3.5 per cent of the population in 2016 compared to 6.2 per cent in 2021.
English is the main language spoken at home for 81.9 per cent of the communities of Baffle Creek, Deepwater and Rules Beach, compared to 87.1 per cent in the Gladstone Region. The only other stated language used at home is Australian Indigenous languages, spoken by five people or 1.7 per cent of the population.
It is worth noting that 16.7 per cent of the population did not state the language used at home.
The main religious followings in Baffle Creek, Deepwater and Rules Beach are: 
- 42.7% - No religion
- 11.4% - Catholic
- 11% - Anglican
- 3.8% - Presbyterian and Reformed
- 1.8% - Uniting Church
- 1.4% - Christianity, nfd
- 0.6% - Pentecostal
In addition to the 45 per cent of the community that stated they had no religion, a further 17.7 per cent did not respond.
This equates to 323 community members either with no religion or unknown and 169 who reported religious affiliation.
The main occupation categories for people aged 15 years and over in Baffle Creek, Deepwater and Rules Beach are:
- 27.6% - Labourers
- 11.2% - Community and personal service workers
- 9.5% - Machinery operators
- 9.5% - Managers
- 9.5% - Sales workers
- 9.5% - Technicians and Trade Operators
- 8.6% - Professionals

The majority of residents in the Baffle Creek, Deepwater and Rules Beach areas are not in the labour force. This category increased by 17.6 per cent between 2016 and 2021.
The most common occupational category was labourers, which remains consistent across the Census period. While continuing to rank as the number one occupational category in 2021 and 2016, the percentage of the workforce in this category increased from 19.4 per cent (18 people) to 27.6 per cent (32 people) in 2021.
The second largest increase was seen in those working in the community and personal service category, representing 6.5 per cent of the workforce in 2016, increasing to 11.2 per cent in 2021.
This is followed by sales workers which represented 5.4 per cent of the workforce in 2016, increasing to 9.5 per cent in 2021, an increase of six people up from five.
Notable decreases were seen in the professional’s occupational category, which made up 19.4 per cent of the work force in 2016, reducing to 8.6 per cent in 2021. This means eight less people work in this category.
The number of managers decreased over the same period from 15 to 11, which was a 6.6 per cent reduction of the workforce in this category.
Smaller decreases were seen in the technicians and trades workers and clerical and administrative workers categories. With the percentage of the workforce in these categories decreasing by 4.5 per cent and 4.9 per cent respectively.
The combined number of people that worked full time has increased by 17.3 per cent between 2016 and 2021. This represents nine people.
This is a trend that has carried across Baffle Creek and Deepwater. While in Rules Beach there has been a slight decrease of people working full time, by three, which is 21.2 per cent of the workforce in 2021 compared 20.3 per cent in 2016.
Over the same period, the number of people that worked part time increased by one person. The proportion of people working part time is different in Baffle Creek, Deepwater and Rules Beach.
In 2016, 9.9 per cent (14 people) of the workforce in Baffle Creek worked part time. This reduced to 6.6 per cent in 2021 (or nine people). In Deepwater, the number of people working part time increased by nine people, meaning 5.8 per cent of the workforce worked part time in 2016 compared to 7.6 per cent in 2021. In Deepwater there were no people that worked part time in 2021, a reduction of 5 people from 2016.
The overall unemployment rate for Baffle Creek, Deepwater and Rules Beach has reduced from 6.7 per cent in 2016 to 4.2 per cent in 2021. Meaning 8 less people are unemployed.
Looking at more localised trends, the number of people unemployed in Rules Beach decreased from four to zero between 2021 and 2016, which took the unemployment rate from 5.8 per cent to 0 per cent between 2016 and 2021.
Deepwater saw a reduction in the unemployment rate from 7.9 per cent in 2016 compared to 4.2 per cent in 2021, which equates to 4 less people unemployed. There was no change in Baffle Creek, with 8 people being unemployed in 2016 and in 2021.
There has also been a 17.6 per cent increase in the percentage of the population not in the workforce since 2016, which equates to 40 people.
Most of this increase is attributed to Deepwater which has seen an increase of 36 people not in the workforce between 2016 and 2021. While there is an increase in number of people not in the workforce, there was a reduction of the percentage of the population not in the workforce. Reducing from 59.7 per cent in 2016 to 57 per cent in 2021.
Data for Baffle Creek shows the number of people not in the work force has stayed static at 74 people in 2016 and 2021 - 52 per cent of the population in 2016 compared to 54 per cent in 2021.
There has also been an increase in the proportion of the community that has not stated their labour force status when looking at combined data. In 2016 it was 12.2 per cent, increasing to 13.9 per cent in 2021. This is an increase of 14 people.
While there has been an increase in the number of people that have not stated their labour force status in the combined data, this is not the case at the suburb level.
The number of people that did not state labour force status in Baffle Creek reduced from 23 people in 2016 to 17 in 2021. Which was 16.3 per cent of the population in 2016 compared to 12.4 per cent in 2021.
In Deepwater there was a notable increase in the number of people not stating their labour force status between 2016 and 2021, increasing from 18 (9.4 per cent of population) in 2016 to 40 people (15.2 per cent of population) in 2021.
In Rules Beach there was a minimal change in the percentage of the population that did not state their labour force status, decreasing from 11.6 per cent in 2016 to 11.5 per cent in 2021, a reduction of 2 people.
When looking at the combined data of Baffle Creek, Deepwater and Rules Beach there have been changes to the top-ranking industries of employment between 2016 and 2021.
In 2021 the top 5 ranked industries were agriculture, forestry and fishing at 19.3 per cent, followed by construction at 14 per cent of the workforce. The third highest ranking industry was accommodation and food services, which was 12.3 per cent of the workforce. While in joint third was mining and administrative support services at 7.9 per cent. Ranking 5 was retail trade at 5 per cent.
In 2016, the top-ranking industry was agriculture, forestry and fishing, employing 10.8 per cent of the workforce. This industry saw an 120 per cent increase in the workforce from 10 people in 2016 to 22 people in 2021. The percentage of the population working in the education and training industry was also 10.8 per cent, ranking joint first. This industry saw a decrease in the percentage of the population undertaking this work, reducing from 10.8 per cent in 2016 compared to 2.6 per cent in 2021. This equates to a reduction in 7 people.
Professional, Scientific and Technical Services ranked second in 2016, making up 9.7 per cent of the workforce. In 2021 there were no people working in this category.
The industry that ranked third was accommodation and food services at 8.6 per cent of the workforce. Followed by 7.5 per cent that did not describe their industry of employment adequately. Ranking 5th was retail trade making up 6.5 per cent of the workforce.
Hours worked
There has been a 10.4 per cent increase in the number of employees working 35 hours or more between 2016 and 2021, an increase of five people when looking at the combined data for Baffle Creek Deepwater and Rules Beach.
In 2021, 36 per cent (15 people) of the Baffle Creek workforce worked over 35 hours, compared to 27 per cent in 2016 (10 people).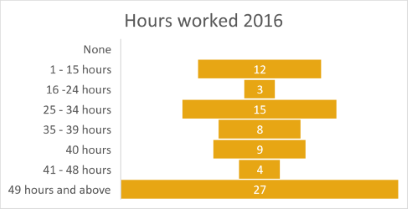
The proportion of people working more than 35 hours was larger in Deepwater at 53 per cent (32 people) of the workforce, which has decreased since 2016 when 72 per cent (26 people) of the workforce were working more than 35 hours.
It is also worth noting that not all detail for Rules Beach is provided in the 2021 Census data, with the number of hours worked not provided for six people which affects the accuracy of the data quoted about hours worked.
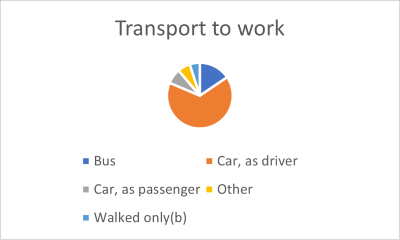
Data from the 2021 census shows 82 per cent of workers travel to their place of work by car, either as driver or passenger.
Considerations:
- There is a large proportion of people working over 35 hours, consideration is to be given to the accessibility and timing of events, activities and programs.
- A large proportion of the workforce are employed in Agriculture, Forestry and Fishing and Accommodation and Food Services which can involve early starts and shift work. This can impact availability to attend events, programs and activities.
The combined data from Baffle Creek, Deepwater and Rules Beach highlights a lower socio-economic profile compared to the Gladstone Region.
- The median weekly household income is $859 compared to $1,693 for the Gladstone Region.
- 2.6 per cent of households earn $3,000 or more per week compared to 25.3 per cent for the Gladstone Region.
- 39.2 per cent households earn less than $650 each week compared to 7.2 per cent for Gladstone Region.
- 49.5 per cent of non-family households earn less than $650 each week which is significantly higher than the Region at 7.2 per cent.
The combined data of Baffle Creek, Deepwater and Rules Beach shows there has been a small increase in the percentage of the population in the labour force between 2016 and 2021. Looking at 2021 data 23.2 per cent of the population were in the workforce compared to 21 per cent in 2016
The unemployment rate in Baffle Creek, Deepwater and Rules Beach has decreased between 2016 and 2021, with 6.7 per cent (27 people) in 2016 compared 4.2 per cent (19 people) in 2021.
There has been an increase in the number of people not in the work force, being 266 in 2021 or 58.8 per cent of the population, compared to 226 people (56.4 per cent) in 2016.
In 2021 there were 63 people that did not state their labour force status compared to 49 in 2016.
In 2021 between 59.3 per cent and 62.3 per cent of households fully owned their housing in Baffle Creek, Deepwater and Rules Beach. Combined data shows 60.5 per cent of the community own their own home which is 33.2 per cent higher than the Gladstone Region, at 27.3 per cent. There was a significant increase in the proportion of households that own their home between 2016 and 2021, increasing by 49.4 per cent from 47 per cent (85 households) in 2016 to 60.5 per cent (127 households) in 2021.
The population of Baffle Creek, Deepwater and Rules Beach that own their home with a mortgage decreased by 1 household between 2016 and 2021. During the same period, the percentage of the population that owned their home with a mortgage decreased by 15.5 per cent, being 29.8 per cent in 2016 and 25.2 per cent in 2021.
There are some differences when looking at a more localised level. The percentage of the population that owned their home with a mortgage increased by 40 per cent in Baffle Creek from 23.4 per cent (15 households) in 2016 to 34.4 per cent (21 households) in 2021.
Deepwater and Rules Beach both saw a decrease in properties owned with a mortgage, with a reduction of 11.4 per cent for Deepwater and 11.1 per cent for Rules Beach between 2016 and 2021. This equates to four less households for Deepwater and 3 for Rules Beach.
There are minimal rentals in Baffle Creek, Deepwater and Rules Beach, with the majority of rentals being provided by a known person not living in the household. There were no properties rented from a community housing provider or State housing authority in 2021 and 2016. No homes were rented from real estate agents in 2021, while four were rented from a real estate agent in 2016, all of which were located in Baffle Creek, making up 2.2 per cent of homes.
In 2021, 14 homes or 6.7 per cent of homes were rented from a person not in the same household, while in 2016, 11 homes were rented from people not in the same household, which is 6.1 per cent of homes.
The average monthly mortgage payments for Baffle Creek, Deepwater and Rules Beach when looking at combined data is $1,121 which is $479 lower than the Gladstone Region and lower than the State by $612. Mortgage re-payments have increased between 2016 and 2021 by $76.
There are some notable differences between monthly mortgage re-payments for Baffle Creek, Deepwater and Rules Beach.
In Baffle Creek mortgage re-payments have increased by $87 between 2016 and 2021, from $1,300 to $1,387. While in Deepwater payments increased by $6 from $843 to $840. Rules Beach saw the largest increase of $135, increasing from $1000 to $1,135.
Data has changed across most mortgage re-payment brackets when looking at the combined data of Baffle Creek, Deepwater and Rules Beach
The largest two increases were seen amongst those paying $1,800-$2,399, which made up 20.8 per cent of households in 2021 or 11 households. There were no households in this price bracket in 2016.
The number of people paying between $1,400 - $1,799 and $0-$299 each made up 5.7 per cent of households in 2021, with number of households in both these brackets increasing from zero in 2016 to three in 2021.
There was a notable decrease in those paying $1,000-$1,399. Households in this bracket made up 16.7per cent of households in 2016 compared to 5.7 per cent in 2021. This equates to a reduction of 6 households.
The number of people paying $300-$439 halved during this period, reducing from six to three households which was a reduction from 11.1 per cent of households to 5.7 per cent.
The average median rent when combining the data of Baffle Creek, Deepwater and Rules Beach has increased by $83 between 2016 and 2021 - from $109 in 2016 to $191 in 2021.
Considerations:
- Nearly half of all families earn less than $650 week, which is significantly more than the region. Given the increasing mortgage repayments and rental costs, consideration should be given to accessibility of programs events and activities which may be harder to access due to low income and rising cost of living pressures.
|
2021 |
% |
2016 |
% |
% change 2016-2021 |
| $1-$74 |
0 |
0 |
6 |
-100.0% |
-26.1 |
| $75-$99 |
0 |
0 |
0 |
0 |
0 |
| $100-$149 |
4 |
20 |
4 |
0.00% |
2.6 |
| $150-$199 |
4 |
20 |
3 |
33.33% |
7 |
| $200-$224 |
0 |
0 |
3 |
-100.0% |
-13 |
| $225-$274 |
0 |
0 |
4 |
-100.0% |
-17.4 |
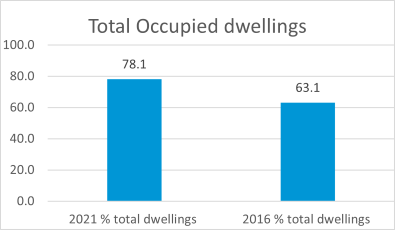
78.1 per cent dwellings are occupied in Baffle Creek, Deepwater and Rules Beach compared with 85 per cent in the Gladstone Region.
Most of the housing in Baffle Creek, Deepwater and Rules Beach is separate houses at 77.7 per cent which is 7 per cent higher than the Gladstone Region. The percentage of properties that are separate houses has increased by 40.2 per cent since 2016 when there were 159 separate houses, while in 2021 there were 209, an increase of 50
There has also been a decrease in the number of ‘other’ dwellings. In 2016 these totaled 17, making up 5.9 per cent of dwellings. In 2021 there were no ‘other’ dwellings.
In 2021, 3 per cent or eight households did not state their dwelling structure.
| Occupancy |
|
2021 % total dwellings |
2016 % total dwellings |
| Total Occupied dwellings |
78.1 |
63.1 |
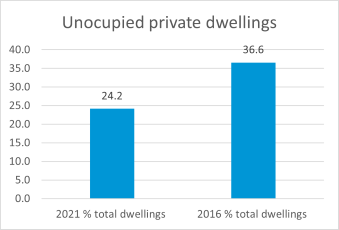
| Unoccupied private dwellings |
24.2 |
36.6 |
13.3 per cent of the community requires assistance with core activities, this represents 66 people.
The number of people requiring assistance has increased by 18 people between the 2016 and 2021 Census data, meaning the percentage of the population that need support with core activities has increased by 37.5 per cent.
In addition, the number of people that have 'not stated' need for assistance has increased from 14.1 per cent (63 people) in 2016 to 16.3 per cent (81 people) in 2021.
The largest proportion of people that required assistance with core activities in 2021 was those aged 55-64, making up 27.3 per cent (18 people) of those that need assistance. Followed by those aged 65-74 or 22.7 per cent (15 people) of people, those aged 45-54 represent 21.2 per cent (14 people) of the population that need assistance.
The largest increase in people needing assistance with core activities between 2016 and 2021 were those aged 75-84. There were no people in this age bracket in 2016 while in 2021 there were 10 people representing 15.2 per cent of those that need assistance.
There are 77 people providing unpaid assistance to a person with a disability, health condition or due to old age within Baffle Creek, Deepwater and Rules Beach. There has been a minimal increase of six people providing unpaid assistance between 2016 and 2021.
There have been several fluctuations in the age of those providing support with no general trend seen from the data. There were decreases across two age brackets. In 2016, 38 per cent (27 people) of those providing assistance were aged 55-64. This reduced by 19.8 per cent or 13 people to 18.2 per cent (14 people) in 2021. The number of people providing support aged 15-19 reduced from three people in 2016 to 0 in 2021.
There were increases across four age brackets, the largest was people aged 65-74 which increased from 15 people to 22 people, taking the percentage of those providing support in this age bracket from 21.1 per cent to 28.6 per cent. The second largest increase was for those aged 35-44 increasing from 4.2 per cent (three people) in 2016 to 9.1 per cent (seven people) in 2021. This is closely followed by people aged 45-54, which increased from 21.1 per cent (15 people) of those providing support in 2016 to 24.7 per cent (19 people) in 2021. The number of people providing support aged 25-34 increased from seven to nine people between 2016 and 2021, this age bracket represented 9.9 per cent of people providing support in 2016 and 11.7 per cent in 2021.
Considerations:
- The majority of people requiring assistance with core activities are aged between 55-84. The movement within these categories could suggest that residents are ageing in place.
- The age of carers providing unpaid assistance has seen similar increases to those requiring care. This could suggest that care is provided in a couple relationship.
|
2021 |
% |
2016 |
% |
% change 2016-2021 |
| Has need for assistance 2021 |
66 |
13.3 |
48 |
10.7 |
37.50% |
| Does not have need for assistance 2021 |
350 |
70.3 |
345 |
77 |
1.45% |
| Need for assistance not stated 2021 |
81 |
16.3 |
63 |
14.1 |
28.57% |
Volunteering is slightly lower in Baffle Creek, Deepwater and Rules Beach with 67 (14.2 per cent) people aged 15 years and over providing volunteer services. This compares to 16.2 per cent for the Gladstone Region.
The numbers for 2016 and 2021 cannot be compared accurately across age brackets as the Census data is not detailed across all communities, this is likely due to the low numbers of respondents and the size of the community.
High level data shows there has been an increase of seven people volunteering in Deepwater, Rules Beach and Baffle Creek.
There are currently eight active community groups in the area, four community sporting groups and two large community events, the Baffle Creek Family Fishing Competition and the Baffle Creek Car and Bike Muster.
Council regularly undertakes a Community Satisfaction Survey to identify community sentiment with respect to its assets, services and programs.
|
Baffle Creek& Deepwater |
Gladstone Region |
LGA Benchmark |
| Overall satisfaction |
56.0% |
55.0% |
55.7% |
|
|
|
|
| ASSETS |
|
|
|
| (1 = very dissatisfied – 100 = very satisfied) |
|
|
|
| Landfills and waste management facilities |
66.2% |
72.9% |
70.2% |
| Art Galleries and museums |
65.9% |
72.7% |
70.7% |
| Public toilets and amenities |
61.4% |
69.1% |
67.7% |
| Libraries |
74.6% |
79.7% |
78.0% |
| Airports and aerodromes |
63.5% |
70.8% |
70.1% |
| Parking facilities and street parking |
57.5% |
66.0% |
65.7% |
| Performing arts centres |
61.4% |
69.1% |
69.0% |
| Lighting and signage |
60.4& |
68.3% |
68.9% |
| Beaches and coastal areas |
66.4% |
73.1% |
73.7% |
| Halls and community centres |
63.4% |
70.7% |
72.2% |
| Stormwater and flood control system |
57.3% |
65.8% |
67.1% |
| Water and sewerage system |
61.8% |
69.4% |
71.5% |
| Boat ramps and jetties |
61.0% |
68.8% |
71.0% |
| Parks and open space |
65.4% |
72.3% |
75.0% |
| Footpaths and cycleways |
56.8% |
65.4% |
68.1% |
| Local roads and bridges |
53.8% |
63.0% |
65.8% |
| Sport and recreation facilities |
61.3% |
69.1% |
73.2% |
| Camping grounds and caravan parks |
55.8% |
64.6% |
68.9% |
| Swimming pools and aquatic centres |
52.5% |
62.0% |
71.5% |
|
|
|
|
| SERVICES |
|
|
|
| (1 = very dissatisfied – 100= very satisfied) |
|
|
|
| Emergency and disaster management |
63.8% |
71.0% |
71.0% |
| Waste services |
68.1% |
74.5% |
74.0% |
| Customer service |
61.6% |
69.3% |
69.7% |
| Consulting with the community |
49.7% |
59.7% |
61.1% |
| Building services |
53.5% |
62.8% |
64.8% |
| Informing the community of council decisions |
52.1% |
61.7% |
64.4% |
| Financial management |
47.8% |
58.2% |
61.1% |
| Environmental management |
53.6% |
62.8% |
66.4% |
| Making and enforcing local laws |
51.2% |
60.9% |
64.9% |
| Advocating on behalf of the community |
49.9% |
59.9% |
64.2% |
| Making decisions in the best interest of the community |
46.6% |
57.3% |
61.5% |
| Planning and development approval |
47.0% |
57.6% |
62.5% |
| Infrastructure and property services |
49.4% |
59.5% |
64.8% |
| Public health services |
54.8% |
63.8% |
71.0% |
|
|
|
|
| INITIATIVES |
|
|
|
| (1: Far too little – 100: Far too much) |
|
|
|
| Affordable housing development |
40.7% |
52.5% |
49.7% |
| Community safety and crime prevention |
34.8% |
47.9% |
47.5% |
| Creative arts development |
49.2% |
59.3% |
59.2% |
| Celebration of multiculturalism |
51.1% |
60.9% |
61.5% |
| Festivals and events |
44.9% |
55.9% |
56.8% |
| Celebration of First Nation culture |
53.0% |
62.4% |
63.3% |
| Business development and support |
42.2% |
54.5% |
55.4% |
| Heritage conservation |
42.2% |
53.7% |
55.1% |
| Tourism development and promotion |
45.1% |
56.1% |
57.3% |
| Placemaking to create lively public spaces |
42.9% |
54.3% |
55.9% |
| Opportunities for people of all abilities to participate in community life |
40.4% |
52.3% |
53.9% |
| Grants and support for sports clubs and community organisations |
45.0% |
56.0% |
57.9% |
| Environmental conservation and climate change action |
43.7% |
55.0% |
56.8% |
| Waste minimisation and recycling |
40.3% |
52.2% |
54.4% |
| Children and youth development |
38.3% |
50.6% |
53.6% |
| Childcare |
42.7% |
54.1% |
57.6% |
| Skill development and networking opportunity |
38.6% |
50.9% |
54.5% |
| Health promotion |
40.3% |
52.3% |
55.8% |
| Newcomer attraction and retention |
39.7% |
51.8% |
55.6% |
| Aged care and accommodation |
26.6% |
41.3% |
50.3% |
Natural Disaster
Baffle Creek, Deepwater and Rules Beach have been affected by natural disater in recent years, with a number of properties lost in the 2018 Central Queensland bush fires.
The fires started on 22 November 2018 and lasted for almost a fortnight affecting communities in Deepwater, Baffle Creek, Rules Beach, Agnes Water, Winfield, Mount Larcom and Ambrose. Dozens of firefighters were flown to the region from interstate to support the QFES, Rural Fire Brigades and SES on the ground.
While the Local Disaster Management Group was coordinating the response to the fires, recovery efforts were also underway.
During this period, Council worked with partners to establish a Recovery Hub in Baffle Creek. For the following 12 months, a State Government funded Community Development Officer worked in afffected communitities.
The Southern area of the Gladstone Region is also impacted by flooding, which can leave some areas cut off from road access.
There has been several discussions with respect to the construction of the Agnes Water to Baffle Creek Link Road project. In March 2020, Council resolved to not proceed with this project due to the signficant capital expenditure and ongoing maintenance costs for the link road.
Customer Service Requests
The Baffle Creek, Deepwater and Rules Beach community engaged with Council on the following top 20 customer service requests from 30 June 2021 to 1 July 2022:
| Customer Service Request Type |
|
| New Initial / Additional Kerbside Collection Levy |
111 |
| Development services enquiries |
72 |
| Request to change address / details |
63 |
| Driveway Access Problems |
58 |
| Gravel Road Repair (corrugations/stones/ruts/dust) |
57 |
| Drainage, Kerb, Channelling, Pipes, Gully Pits, Drains |
52 |
| Roads - grading, potholes, debris, bitumen repair |
48 |
| Missed Wheelie Bin / Collection Problem |
45 |
| New Rural Street Address and Replacement Marker |
44 |
| Public Waste Services Miscellaneous Request |
44 |
| Pest Noxious Weed / Plant Request |
43 |
| Information Request General |
40 |
| Repair / Replacement of Wheelie Bin Request |
36 |
| Stray / Wandering Livestock - Cattle & Horses |
33 |
| Building & Plumbing Compliance |
30 |
| Planning Compliance |
29 |
| Illegal Dumping / Littering Report |
21 |
| Collection of Found / Privately Impounded Animal |
20 |
| Environmental Health Licensing Enquiry |
20 |
| Waste Admin Haulage for Transfer Stations |
20 |
Rating Arrears
The Baffle Creek, Deepwater and Rules Beach socio-economic position is lower than the Gladstone Region. The median weekly household income for these areas is $859 compared to $1,693 for the Gladstone Region.
Analysing the combined data for Baffle Creek, Deepwater and Rules Beach, the rate arrears are the highest amongst all nine profiles created as part of the 2021/22/23 Operational Plan projects.
Baffle Creek had 22 residential properties in rate arrears at 30 October 2022, which equates to 18.5% of rateable properties. In Deepwater, 55 properties were in arrears, which is 17.6% of rateable properties. Whilst Rules Beach has 13 properties in arrears, equating to 14.8% of rateable properties.
The total rateable residential properties in Gladstone is 13,008. On average, 15.4% of households have outstanding rate payments.
Education
Wartburg State School
Early Childhood – Year 6
Co-educational
17 Students
Community Facilities
Baffle Creek Community Centre
371 Coast Road
Hall seating up to 30 people with a kitchen facility and grounds also available for hire
Childcare
Wartburg State School Kindergarten
9am –3pm
Community Groups
- Baffle Creek Community Inc
- Baffle Creek Mens Shed Inc
- Baffle Creek Youth Group
- Baffled Learners
- Catholic Chapel Baffle Creek
- Baffle Creek Art Group
- Baffle Creek Car/Bike Muster
- Baffle Creek Garden Club
Sporting Groups
- Baffle Creek Boat Club
- Baffle Creek Fishing Club
- Baffle Creek Golf Club
- Baffle Creek Riders Association
Community-led Events
- Baffle Creek Car/Bike Muster
- Baffle Creek Family Fishing Competition
Parks
- Baffle Creek Nomad Caravan Park
- Baffle Creek Conservation Park
- Mouth of Baffle Creek Conservation Park
- Deepwater National Park
Sport & Recreation