Located at the Southern End of the Great Barrier Reef the coastal towns of Agnes Water and 1770 are well known tourist destinations with pristine beaches and wildlife and known for being the most northerly beach on the east coast to regularly receive the Tasman Sea Swell. Agnes Water and 1770 is also home to the Agnes Water Community Centre, Library and Rural Transaction Centre, operated by Gladstone Regional Council. With many community-led events such as the Agnes Water Blues and Roots Festival, 1770 Festival and the Cultural Connections Immersion Festival.
The data table below has been created using two suburb level data sets. Whilst there are clear trends across the combined data sets these are pronounced or less pronounced at a suburb level. These differences will be highlighted when significant.
Observations
- Agnes Water and 1770 have an average median age which has slowly increased over time and is higher than the region and State by 15 years. The median average age of Agnes Water and 1770 combined was 53 years in 2021, for Agnes Water alone it is 49 (an increase of eight years from 2011) and 57 for the town of 1770 (a decrease of one year since 2011).
- The towns of Agnes Water and 1770 significantly lower cultural diversity than the Gladstone Region and the State which decreased in 2011, 2016 and 2021.
- Agnes Water and 1770 have an increasing proportion of couples without children, which is higher than the region and almost double than the State.
- Both towns have significantly lower average income compared the region and State.
- The average percentage of households with a mortgage in Agnes Water and 1770 is 23.4 per cent. For Agnes Water alone 28.8 per cent of the population have a mortgage which is higher than 17.9 per cent in 1770. Both Agnes Water and 1770 have a lower proportion of community with a mortgage compared to 37 per cent of the Region and 34.4 per cent of the State
- Median monthly mortgage payments in 1770 have increased by $1,153 since 2016 and have decreased by $190 for Agnes Water. The average monthly mortgage payments for Agnes water and 1770 combined has steadily increased between 2021 and 2011.
- The number of people attending university is higher than the region, but lower than the State.
Compared to the Gladstone Region and Queensland, the towns of Agnes Water and 1770 has:
|
Average of totals |
|
|
|
Gladstone Region |
Queensland |
|
2021 |
2016 |
2011 |
Change 2021- 2011 |
Change 2021- 2016 |
Change 2016 - 2011 |
2021 |
2021 |
| Median age |
53 |
49.5 |
49.5 |
3.5 |
3.5 |
0 |
38 |
38 |
| Non English Speaking backgrounds |
0.20% |
0.80% |
3.20% |
-93.8% |
-75.0% |
-75.0% |
5.00% |
12.60% |
| Couple Family with Children |
33.10% |
36.20% |
35.80% |
-7.5% |
-8.6% |
1.1% |
41.70% |
55.40% |
| Couple family without children |
55.30% |
43.90% |
45.00% |
22.9% |
26.0% |
-2.4% |
40.50% |
28.00% |
| Average number of people per household |
2.2 |
2.1 |
2.2 |
0.0% |
4.8% |
-4.5% |
2.5 |
2.5 |
| Households with a mortgage |
23.40% |
28.60% |
25.70% |
-8.9% |
-18.2% |
11.3% |
37.00% |
34.40% |
| Households renting |
9% |
11% |
23.10% |
-61.0% |
-18.2% |
-52.4% |
33.40% |
33.00% |
| Median weekly household income |
$1,031 |
$1,131 |
$705 |
46.2% |
-8.8% |
60.4% |
$1,639 |
$1,675 |
| Median monthly mortgage repayments |
$2,000 |
$1,519 |
$750 |
166.7% |
31.7% |
102.5% |
$1,600 |
$1,733 |
| Median weekly rent (overall) |
$310 |
$283 |
$135 |
129.6% |
9.5% |
109.6% |
$275 |
$365 |
| University attendance |
11.30% |
2.60% |
1.40% |
707.1% |
334.6% |
85.7% |
7.20% |
14.20% |
In 2021 the towns of Agnes Water and 1770 had a combined population of 2,859, with 2,729 people in Agnes Water and 125 in 1770. Since 2011 the population of 1770 has increased by 51 and by 916 people in Agnes Water, a total increase of 967.
In 2021 the average median age for Agnes Water and 1770 median age for Gladstone was 53, in 2016 and 2011 this was 49.5. The average age is higher than the region and the State both with a median age of 38. At a suburb level there are differences in the median age.
In Agnes Water the median age has increased from 41 in 2011, 45 in 2016 and 49 in 2021.
The median age for 1770 is significantly higher than the region/State and Agnes Water, being 58 in 2011, 54 in 2016 and 57 in 2021.
Between 2011 and 2021 there was a general decrease in the percentage of the community that were aged 0-49 when comparing the combined data from Agnes Water and 1770.
The percentage of the population that is aged zero to four decreased by 18 per cent when compared to 2011. While the percentage of population aged five to nine increased by 3.4 per cent.
During this same period there was an increase in the percentage of the population aged 50 to 85 years and older. The most notable increase can be seen for those aged 70-74, with a 290 per cent increase from 2011 to 2021. This equates to an additional 145 people.
Agnes Water and 1770 has an ageing population, with 17.2 per cent of the population being empty nesters and retirees up from 14.8 per cent of the population in 2011 which is an increase of 298 people. The number of seniors aged 70 to 84 has increased by 226 people or 233 per cent compared to 2011.
The percentage of the population that are children aged 19 and under decreased between 2011 and 2021. Those aged zero to four made up 3.4 per cent of the population in 2021 compared to 7.4 per cent in 2011, which is a reduction of 25 people. Those aged 5-19 made up 13.2 per cent of the population in 2021 compared to 19 per cent in 2011. While decreasing as a percentage of population there was an increase of 85 people in this age bracket.
In 2021 the age groups that differ most to the Gladstone Region are:
- The percentage of the population that is aged 5-19 is 17.7 per cent less than the Gladstone Region when looking at combined data for Agnes Water and 1770.
- Those aged 0-4, 20-24, 25-29 and 85+ represent a smaller percentage of the population when compared to the region.
- While the percentage of parents and home builders aged 30-49 has decreased as a percentage of the population since 2011, there are 18.7 per cent less in this age bracket when compared to the region.
- Those aged 50-59, 60-69 and 70-84 made up a higher percentage of the population in 2021 when compared to the region.
There will be continued demand for diverse services and activity opportunities to cater for all age groups in Agnes Water and 1770.
Consideration needs to be given there is an ageing population increasing in numbers and a larger percentage of the population. There is a decrease in the percentage of younger people and children making up the population with slight increase in numbers when compared to seniors.
| Age |
Totals |
|
Gladstone Region |
Queensland |
|
2021 Pop |
% pop |
2016 Pop |
% pop |
2011 pop |
% pop |
% Change 2011- 2021 |
% Change 2016- 2021 |
% Change 2011- 2016 |
2021 Pop |
% pop |
2021 Pop |
% pop |
| Median age |
|
N/A |
|
-- |
|
NA |
NA |
NA |
|
38 |
N/A |
38 |
N/A |
| 0-4 years |
114 |
3.987408 |
115 |
5.046073 |
139 |
7.4 |
-18.0% |
-0.9% |
-17.3% |
4,049 |
6.4 |
292,452 |
5.7 |
| 5-9 years |
152 |
5.316544 |
158 |
6.932865 |
147 |
7.8 |
3.4% |
-3.8% |
7.5% |
4,686 |
7.4 |
329,311 |
6.4 |
| 10-14 years |
172 |
6.01609 |
145 |
6.36244 |
136 |
7.2 |
26.5% |
18.6% |
6.6% |
4,913 |
7.7 |
342,560 |
6.6 |
| 15-19 years |
120 |
4.197272 |
120 |
5.265467 |
76 |
4 |
57.9% |
0.0% |
57.9% |
4,001 |
6.3 |
313,506 |
6.1 |
| 20-24 years |
68 |
2.378454 |
63 |
2.76437 |
61 |
3.2 |
11.5% |
7.9% |
3.3% |
3,159 |
5 |
323,739 |
6.3 |
| 25-29 years |
70 |
2.4 |
77 |
3.4 |
77 |
4.1 |
-9.1% |
-9.1% |
0.0% |
3,766 |
5.9 |
347,687 |
6.7 |
| 30-34 years |
144 |
5 |
112 |
4.9 |
106 |
5.6 |
35.8% |
28.6% |
5.7% |
4,066 |
6.4 |
354,033 |
6.9 |
| 35-39 years |
166 |
5.8 |
134 |
5.9 |
137 |
7.3 |
21.2% |
23.9% |
-2.2% |
4,280 |
6.7 |
357,120 |
6.9 |
| 40-44 years |
196 |
6.9 |
166 |
7.3 |
166 |
8.8 |
18.1% |
18.1% |
0.0% |
4,069 |
6.4 |
330,692 |
6.4 |
| 45-49 years |
219 |
7.7 |
194 |
8.5 |
153 |
8.1 |
43.1% |
12.9% |
26.8% |
4,158 |
6.5 |
340,287 |
6.6 |
| 50-54 years |
250 |
8.7 |
246 |
10.8 |
153 |
8.1 |
63.4% |
1.6% |
60.8% |
4,546 |
7.2 |
333,843 |
6.5 |
| 55-59 years |
265 |
9.3 |
213 |
9.3 |
155 |
8.2 |
71.0% |
24.4% |
37.4% |
4,524 |
7.1 |
316,378 |
6.1 |
| 60-64 years |
306 |
10.7 |
189 |
8.3 |
161 |
8.5 |
90.1% |
61.9% |
17.4% |
4,154 |
6.5 |
298,919 |
5.8 |
| 65-69 years |
272 |
9.5 |
181 |
7.9 |
119 |
6.3 |
128.6% |
50.3% |
52.1% |
3,190 |
5 |
264,515 |
5.1 |
| 70-74 years |
195 |
6.8 |
101 |
4.4 |
50 |
2.6 |
290.0% |
93.1% |
102.0% |
2,532 |
4 |
238,952 |
4.6 |
| 75-79 years |
94 |
3.3 |
44 |
1.9 |
27 |
1.4 |
248.1% |
113.6% |
63.0% |
1,507 |
2.4 |
168,385 |
3.3 |
| 80-84 years |
34 |
1.2 |
15 |
0.7 |
20 |
1.1 |
70.0% |
126.7% |
-25.0% |
886 |
1.4 |
106,611 |
2.1 |
| 85 years and over |
22 |
0.8 |
6 |
0.3 |
4 |
0.2 |
450.0% |
266.7% |
50.0% |
677 |
1.1 |
98,135 |
1.9 |
| Group |
Age |
Totals |
Gladstone Region |
|
|
2021 |
% pop |
2016 |
% pop |
2011 |
% pop |
% Change 2011- 2021 |
% Change 2016- 2021 |
% Change 2011- 2016 |
2021 |
% pop |
| Babies and pre-schoolers |
0-4 yrs |
114 |
3.4 |
115 |
5 |
139 |
7.4 |
-18.0% |
-0.9% |
-17.3% |
4,049 |
6.40% |
| Primary and secondary schoolers |
5-19 yrs |
444 |
13.2 |
423 |
18.6 |
359 |
19 |
23.7% |
5.0% |
17.8% |
13,600 |
28.80% |
| Tertiary education and independence |
20-24 yrs |
68 |
2 |
63 |
2.8 |
61 |
3.2 |
11.5% |
7.9% |
3.3% |
3,159 |
5.00% |
| Young workforce |
25-29 yrs |
70 |
2.1 |
77 |
3.4 |
77 |
4.1 |
-9.1% |
-9.1% |
0.0% |
3,766 |
5.90% |
| Parents and home builders |
30-49yrs |
725 |
21.6 |
606 |
26.6 |
562 |
29.8 |
29.0% |
19.6% |
7.8% |
16,933 |
26.60% |
| Older workers and retirees |
50-59 yrs. |
515 |
15.4 |
459 |
20.1 |
308 |
16.3 |
67.2% |
12.2% |
49.0% |
9,070 |
14.30% |
| Empty nesters and retirees |
60-69 yrs |
578 |
17.2 |
370 |
16.2 |
280 |
14.8 |
106.4% |
56.2% |
32.1% |
7,344 |
13.60% |
| Seniors |
70-84 yrs |
323 |
9.6 |
160 |
7 |
97 |
5.1 |
233.0% |
101.9% |
64.9% |
4,925 |
7.80% |
| Elderly aged |
85+ |
22 |
0.7 |
6 |
0.3 |
4 |
0.2 |
450.0% |
266.7% |
50.0% |
679 |
1.10% |
Service group breakdown compared to the Region, source ABS 2021, 2016, 2011
The townships of Agnes Water and 1770 has diverse household types with the main groups being couples with children and couples without children.
The percentage of couple families with children in Agnes Water and 1770 is 32.9 per cent which is lower than the region at 41.7 per cent and the State 41.2 per cent.
In Agnes Water alone, couple families with children made up 33.1 per cent of the population in 2021 compared to 35.8 per cent of the population 2011. This is higher than the township of 1770 where couple families with children made up 23 per cent of the population in 2011.
The number of couple families increased by 157 between 2021 and 2011 for combined Agnes Water and 1770 data, with 152 of the families being based in Agnes Water.
The number of one parent families has fluctuated slightly over time when looking at combined data. With 71 families in 2021 (10.1 per cent of families), 65 in 2016 (11.4 per cent of families) and 76 in 2011 which was 15.3 per cent of families.
The percentage of one parent families in Agnes Water and 1770 is lower than the region and State 10.4 per cent. In the region 16.6% of families are one parent families, compared to 163.8% of families in the State in 2021.
There are 928 people in Agnes Water and 1770, which is 49.4 per cent of the population in 2021, which is higher compared to the Gladstone Region at 43.6 per cent.
There has been a steady increase of those in a registered marriage in Agnes Water and 1770, with 51.4 percentage increase between 2011 and 2021.
People in a De facto marriage increased by 74.4 per cent, or 122 people between 2021 and 2011.
Considerations:
- There is a need to provide a range of programs and services including for couples without children, families with children and individuals.
- When planning and programming specific consideration need to be given to the fact there is a higher proportion of couple families without children.
Family composition
|
Agnes Water and 1770 |
|
|
|
Gladstone Region |
Queensland |
|
2021 |
2021 % pop |
2016 |
2016 % pop |
2011 |
2011 % pop |
% Change 2011- 2021 |
% Change 2016- 2021 |
% Change 2011- 2016 |
2021 pop |
Gladstone Region % pop |
2021 pop |
% pop |
| Couple family without children |
398 |
56.4 |
301 |
52.8 |
241 |
48.4 |
65.1% |
32.2% |
24.9% |
1100744 |
40.5 |
551069 |
40.3 |
| Couple family with children |
232 |
32.9 |
204 |
35.8 |
176 |
35.3 |
31.8% |
13.7% |
15.9% |
2176414 |
41.7 |
563237 |
41.2 |
| One parent family |
71 |
10.1 |
65 |
11.4 |
76 |
15.3 |
-6.6% |
9.2% |
-14.5% |
603223 |
16.6 |
230026 |
16.8 |
| Other family |
5 |
0.7 |
0 |
0 |
5 |
1 |
0.0% |
0.0% |
-100.0% |
202 |
1.2 |
22230 |
1.6 |
Social Marital Status
| Social marital status |
Agnes Water and 1770 |
|
|
|
Gladstone Region |
|
2021 |
% pop |
2016 |
% pop |
2011 |
% pop |
% Change 2011- 2021 |
% Change 2016- 2021 |
% Change 2011- 2016 |
2021 pop |
% pop |
| Registered marriage |
928 |
49.4 |
746 |
50.6 |
613 |
51.5 |
51.4% |
24.4% |
21.7% |
20253 |
43.60% |
| De facto marriage |
286 |
15.2 |
219 |
14.9 |
164 |
13.8 |
74.4% |
30.6% |
33.5% |
6476 |
14.80% |
| Not married |
663 |
35.3 |
509 |
34.5 |
414 |
34.8 |
60.1% |
30.3% |
22.9% |
16998 |
0 |
source ABS 2021, 2016, 2011
In 2021, 71.7 per cent of the Agnes Water and 1770 population was born in Australia, compared to 79.6 per cent in the Gladstone Region.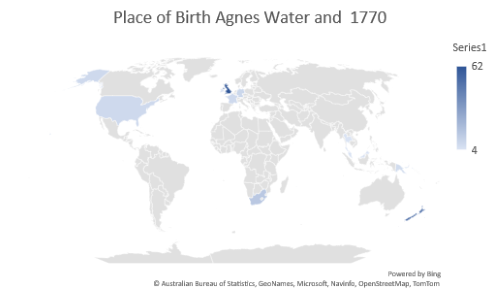
A further 9.2 per cent were born overseas from other English-speaking countries including, Canada, England, Ireland New Zealand, South Africa, and United States of America.
In Agnes Water and 1770, 0.2 per cent of the community were born in seven different non-English speaking countries. This has been consistently decreasing across the decade.
The townships of Agnes Water and 1770 includes 92 Aboriginal and Torres Strait Islander people, which is 3.2 per cent of the population.
There are very few Aboriginal and Torres Strait Islander people living in 1770, in 2021 there were three while in 2016 and 2011 there were none.
When looking at the township of Agnes Water in isolation there has been a gradual increase in the Aboriginal and Torres Strait Islander community, with 42 community members in 2011, 66 in 2016 and 89 in 2021. This represents 3.2 per cent of the community, 2.9 per cent and in 2021 3.2 per cent.
English is the main language spoken at home for 81.5 per cent of the communities of Agnes Water and 1770 compared to 87.1 per cent in the Gladstone Region. There is also 3.5 per cent of households in Agnes Water and 1770 that speak another language other than English at home, with 10 languages spoken.
The main religious followings in Agnes Water and 1770 are:
- 45% - No religion
- 11.8% - Catholic
- 11.1% - Anglican
- 3.7% - Uniting Church
- 3% - Presbyterian and Reformed
- 2.5% - Christianity, nfd
- 1.1% - Buddhism
- 1% - Pentecostal
- 0.8% - Lutheran
- 0.7% - Seventh-day Adventist
In addition to 45 per cent of the community stating they had no religion, a further 17.5 per cent did not respond.
This equates to 1,707 community members either with no religious affiliation or unknown and 1087 who reported religious affiliation.
There has some fluctuation in the percentage of the community stating they have no religion. In 2011 this was 31 per cent of the community, while in 2016 it was 28.7 per cent and increasing to 45 per cent in 2021.
The main occupation categories for people aged 15 years and over in Agnes Water and 1770 are:
- 19.8% - Technicians and Trade Operators

- 14.5% - Professionals
- 13.5% - Labourers
- 12.8% - Managers
- 12.6% - Community and personal service workers
- 10.2% - Clerical and administrative workers
The communities of Agnes Water and 1770 have seen a significant change in its population between 2011 and 2021. With an increase of 392 people between 2011 and 2016 and a further increase of 580 between 2016 and 2021. This equates to an increase of 972 people, meaning the population has grown by a third between 2021 and 2011.
There have been changes across all occupational categories, some categories have seen a decrease in a percentage of the workforce while seeing an increase in the number of people working within the category.
Technicians and trades workers made up the highest proportion of the workforce in 2011, 2016 and 2011. The second largest profession was labourers in 2011 and 2016 at 14.6 per cent (105 people), 15.5 per cent (136 people), while in 2021 it was professionals at 15.5 per cent (152 people).
The third highest occupation is different across each of the census data sets reviewed. In 2011 the third highest occupation category is shared jointly between clerical and administrative workers and sales workers, with 11.3 per cent of the workforce working in each of these occupational categories.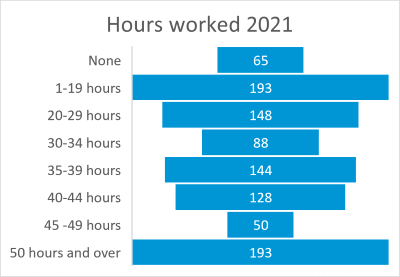
While in 2016, 14.9 per cent or 131 people worked in the managers occupational category and in 2011 the third highest occupational category was labours.
In 2011 managers made up 11.5 per cent of the workforce, in 2016 professionals made up 12.6 per cent and in 2021 managers made up 12.8 per cent of the workforce. This data is for all occupational categories that were fourth in their census year.
Professionals ranked fifth in 2011, while in 2016 and 21 Community and personal service workers ranked fifth at 11.4 per cent and 12.6 per cent of the workforce.
Between 2011 and 2016 there was a decrease in the number of people working across all occupational categories with the exception of labours which increased from 343 people or 2.1 per cent of the workforce to 718 people.
The largest increase as a percentage of the workforce between 2021 and 2011 was those working as professionals. There were 84 more people working in this category than in 2011, which was an increase 4.5 per cent.
Sales workers made up 9.2 per cent of the workforce in 2011 compared to 7.1 per cent in 2021, which means there is 4.2 per cent less people in the workforce that have an occupation in sales. This is the largest decrease across the data set.
The number of people that worked full time has increased by 122 people, or 30 per cent between 2011 and 2021.
Over the same period the number of people that work part time has increased by 170 people, meaning there has been an increase of 66.1 per cent in the population that work part time compared to 2011.
The unemployment rate for Agnes Water and 1770 has reduced from 5.5 per cent in 2011 and 2016 to 3.8 per cent in 2021.
There has also been a 69.7 per cent increase in the percentage of the population not in the workforce since 2011, which equates to 394.
There has also been a sizable increase in the proportion of the community that has not stated their labour force status. In 2011 it was 7.3 per cent, increasing to 10.9 per cent in 2016 and 13 per cent in 2021. This is an increase of 207 people.
When looking at the combined data of Agnes Water and 1770, there have been changes in the percentage of the population working across all industry types.
While there have been some changes in the top five ranked industries of employment between 2021, 2016 and 2011, retail trade and accommodation and food service have featured across all years.
In 2011 the top five ranked industries were construction at 17.4 per cent of the workforce, followed by accommodation and food services (15.1 per cent), retail trade (11.3 per cent), transport postal and warehousing (6.3 per cent) and manufacturing (5.7 per cent).
In 2016 the rankings were accommodation and food services (18.9 per cent), wholesale trade (14.3 per cent), retail trade (9.3 per cent), education and training (7.3 per cent) and healthcare (5.9 per cent) and assistance.
While in 2021 the top five industries of employment were accommodation and food services (17.9 per cent), construction (12.8 per cent), education and training (8.7 per cent), retail trade (8.4 per cent), mining at (6.8 per cent) of the workforce.
When looking at the townships of Agnes Water and 1770 data separately there are some differences particularly for the township of 1770. With professional, scientific and technical services ranking in the top five industries at 14.3 per cent, 9.1 per cent and 11.5 per cent in 2021, 2016 and 2011. The other top ranking industry not present in the combined data is rental, hiring and real estate services at 16.7 per cent, 9.1 per cent and 15.4 per cent in 2021, 2016 and 2011.
The most notable changes when looking at the combined data of Agnes Water and 1770 include a 30 per cent reduction in population that work in wholesale trade between 2011 and 2021.
During this period there was also 222 per cent increase in the percentage of the workforce within the mining industry. Which was 3.1 per cent or 22 people in 2011 compared to 6.8 per cent or 71 people in 2021. The second largest increase was seen in the percentage of the population working in education and training, being 5.6 per cent in 2011 and increasing to 8.7 per cent. Which equated to an increase of 51 people, up from 40.
In 2011 15.1 per cent of the workforce were based in accommodation and food service industries, this represented 109 people. This increased to 17.9 per cent of the workforce by 2021, with an additional 78 people working in this industry.
Hours worked can only be shown for 2021 and 2016 due this data not being capture in the census during 2011.
There has been a 16 per cent increase in the number of employees working 35 hours or more between 2016 and 2021, an increase of 72 people when looking at the combined data of Agnes Water and 1770.
In 2021 and 2016 just over 50 per cent of the work aged population worked over 35 hours in Agnes Water while in 1770 this was 26.2 per cent in 2021 and 27 per cent in 2016.
Data from the 2021 census shows 83 per cent of workers travel to their place of work by car, either as driver or passenger.
Considerations:
- There is a significant increase in those working in rental hiring and estate service in 1770, this could relate to an increase in holiday rentals and AirBnB type set ups and impact housing availability.
- Over 50 per cent of those that work in Agnes Water are working over 35 hours with and increasing number of people working in accommodation and food services consideration needs to be given to timings of meetings, events and activities.
| Industry |
2021 Pop |
% pop |
2016 Pop |
% pop |
2011 pop |
% pop |
% Change 2011- 2021 |
% Change 2016- 2021 |
% Change 2011- 2016 |
| Agriculture, Forestry and Fishing |
10 |
1 |
27 |
3.1 |
13 |
1.8 |
-23.1% |
-63.0% |
107.7% |
| Mining |
71 |
6.8 |
33 |
3.8 |
22 |
3.1 |
222.7% |
115.2% |
50.0% |
| Manufacturing |
40 |
3.8 |
29 |
3.3 |
41 |
5.7 |
-2.4% |
37.9% |
-29.3% |
| Electricity, Gas, Water and Waste Services |
13 |
1.2 |
15 |
1.7 |
14 |
1.9 |
-7.1% |
-13.3% |
7.1% |
| Construction |
134 |
12.8 |
15 |
1.7 |
125 |
17.4 |
7.2% |
793.3% |
-88.0% |
| Wholesale Trade |
9 |
0.9 |
126 |
14.3 |
13 |
1.8 |
-30.8% |
-92.9% |
869.2% |
| Retail Trade |
88 |
8.4 |
87 |
9.9 |
81 |
11.3 |
8.6% |
1.1% |
7.4% |
| Accommodation and Food Services |
187 |
17.9 |
166 |
18.9 |
109 |
15.1 |
71.6% |
12.7% |
52.3% |
| Transport, Postal and Warehousing |
34 |
3.3 |
39 |
4.4 |
45 |
6.3 |
-24.4% |
-12.8% |
-13.3% |
| Information Media and Telecommunications |
4 |
0.4 |
3 |
0.3 |
3 |
0.4 |
33.3% |
33.3% |
0.0% |
| Financial and Insurance Services |
11 |
1.1 |
16 |
1.8 |
8 |
1.1 |
37.5% |
-31.3% |
100.0% |
| Rental, Hiring and Real Estate Services |
28 |
2.7 |
29 |
3.3 |
29 |
4 |
-3.4% |
-3.4% |
0.0% |
| Professional, Scientific and Technical Services |
55 |
5.3 |
37 |
4.2 |
34 |
4.7 |
61.8% |
48.6% |
8.8% |
| Administrative and Support Services |
49 |
4.7 |
39 |
4.4 |
25 |
3.5 |
96.0% |
25.6% |
56.0% |
| Public Administration and Safety |
48 |
4.6 |
41 |
4.7 |
23 |
3.2 |
108.7% |
17.1% |
78.3% |
| Education and Training |
91 |
8.7 |
64 |
7.3 |
40 |
5.6 |
127.5% |
42.2% |
60.0% |
| Health Care and Social Assistance |
67 |
6.4 |
52 |
5.9 |
36 |
5 |
86.1% |
28.8% |
44.4% |
| Arts and Recreation Services |
11 |
0 |
11 |
1.3 |
0 |
0 |
0 |
0.0% |
0 |
| Other Services |
36 |
0.6 |
27 |
3.1 |
30 |
4.2 |
20.0% |
33.3% |
-10.0% |
| Inadequately described/Not stated |
56 |
5.4 |
48 |
5.5 |
29 |
4 |
93.1% |
16.7% |
65.5% |
The combined data from the town of Agnes Water and 1770 have a lower socio-economic profile of the Gladstone Region:
- The median weekly household income is $1,031 compared to $1,693 for the Gladstone Region.
- 25.2 per cent of households earn $3,000 or more per week compared to 25.3 per cent for the Gladstone Region
- 6.9 per cent households earn less than $650 each week compared to 7.2 per cent for Gladstone Region, which is a decrease of per cent compared to 2016.
- 47 per cent of non-family households earn less than $650 each week which is significantly higher than the region at 7.2 per cent. In addition to family households, 41.4 per cent of non family households earn less than $650 per week.
The combined data of Agnes Water and shows there has been a reduction in the percentage of the population in the labour force since 2011. Looking at 2021 data 43.7 per cent of the population were in the workforce compared to 46.6 per cent in 2016 and 48.7 per cent in 2011.
The unemployment rate for the towns of Agnes Water remained static in 2011 and 2011 at 5.5 per cent (80 and 103 people) reducing to 3.8 per cent (91 people) in 2021.
There has been a notable increase in the number of people not in the work force, being 959 in 2021 or 39.8 per cent of the population. Compared to 680 people (36.4 per cent) in 2016 and 565 (38.5 per cent) in 2021.
In 2021 there were 314 people that did not state their labour force status compared to 107 in 2011.
The SEIFA index of relative socio-economic disadvantage for 2016 looks at data at and SA2 level. The data in this profile is at a more localized level which means SEIFA data is not possible to review.
The SEIFA score for Gladstone Region in 2016 was 978.Across Australia’s local government areas, SEIFA scores range from 188 (most disadvantaged) to 1186 (least disadvantaged).
In 2021, 42.3 per cent of households fully owned their housing which is 54.9 per cent higher than the Gladstone Region at 27.3 per cent. There has been a steady increase in the number of people that own their home outright.
In 2011, 30.1 per cent of the population owned their home outright which equated to 205 people. This increased by 36.5 per cent of the population in 2016, with 280 people owing their home outright. Before increasing in 2021 to 30.1 per cent of the population or 280 people.
The population of Agnes Water and 1770 that owns there home with a mortgage has fluctuated over time. In 2011 29.4 per cent (200 households) owned their home with a mortgage, this increased to 34.6 per cent or 283 households in 2016 before reducing again to 29.6 per cent of the population in 2021, representing 308 households.
While the percentage of households renting has increased by 8.17 per cent between 2011 and 2021, the number of households has increased slightly. In 2011 208 household rented, decreasing to 205 in 2016 and increasing slightly to 225 in 2021.
The average mortgage payments of Agnes Water and 1770 when looking at combined data is $2,000 which is higher than the Gladstone Region by $400 and higher than the State by $267. Mortgage payments have significantly increased over time, resulting in a net increase of $1,250 between 2021 and 2011. With payments being $750 in 2011, $1,519 in 2016 and $2,000 in 2021.
While the above data looks at combined data there is a notable difference in the median monthly mortgage payments for Agnes Water and 1770 when looking at stand alone data.
Mortgage payments in Agnes Water have fluctuated over time and are in line with the Region but lower than the State. Being $1,500 in 2011, $1,690 in 2016 and $1,500 in 2021.
While for 1770 there is no data for 2011, in 2016 median mortgage payments were $1,347. Between 2021 and 2016 payments increased by $1,153 to $2,500.
Data has changed across all mortgage payment brackets when looking at the combined data of Agnes Water and 1770.
The largest two increase were seen amongst those paying $1,400 - $1,799, which made up 11.7 per cent of households in 2011 or 23 households., increasing to 21.4 per cent in 2021 or 66 households.
The average median rent when combining data from Agnes Water and 1770 has increased over time. Being $135 in 2011, $283 in 2016 and $310 in 2021, which is an increase of $175 per week.
With most of this impact being in Agnes Water as there is only rental data available for six households in 1770.
Considerations:
- Median rent prices are increasing, the number of non-family households earning less than $650 a week is significantly higher than the region and household income is also significantly. Consideration needs to be given on to the cost of services, activities and programs.
| Rent |
2021 |
% |
2016 |
% |
% Change 2016- 2021 |
| $1-$74 |
0 |
0 |
22 |
10 |
0% |
| $75-$99 |
3 |
1.3 |
0 |
0 |
100.0% |
| $100-$149 |
4 |
1.7 |
5 |
2 |
-25.0% |
| $150-$199 |
5 |
2.1 |
13 |
6 |
-160.0% |
| $200-$224 |
15 |
6.4 |
17 |
7 |
-13.3% |
| $225-$274 |
37 |
15.9 |
32 |
14 |
13.5% |
| $275-$349 |
55 |
23.6 |
69 |
30 |
-25.5% |
| $350-$449 |
74 |
31.8 |
53 |
23 |
28.4% |
| $450-$549 |
20 |
8.6 |
10 |
4 |
50.0% |
| $550-$649 |
4 |
1.7 |
3 |
1 |
25.0% |
| $650-$749 |
0 |
0 |
0 |
0 |
0 |
| $750-$849 |
0 |
0 |
0 |
0 |
0 |
| $850-$949 |
0 |
0 |
0 |
0 |
0 |
| $950 and over |
0 |
0 |
0 |
0 |
0 |
| Rent not stated |
10 |
4.3 |
9 |
4 |
10.0% |
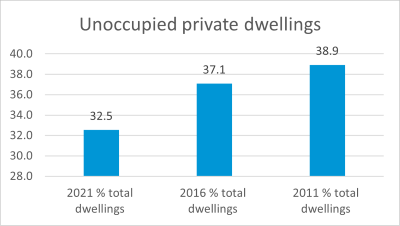
67.1 per cent dwellings are occupied in Agnes Water and 1770, compared with 85 per cent in the Gladstone Region.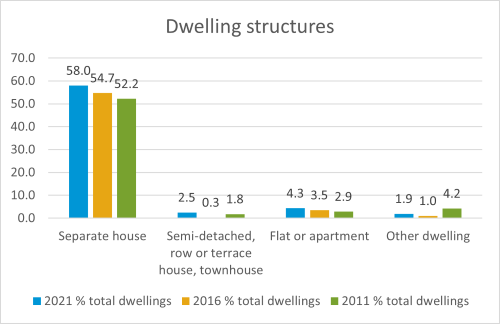
Most of the housing in Agnes Water and 1770 is separate houses at 58 per cent which is lower than the Gladstone Region. There has been an increase in the number of flats and apartments which has increased from 32 in 2011 to 46 in 2016 and 67 in 2021. This means 4.3 per cent of the Agnes Water and 1770 population live in flats or apartments.
The number of semi-detached, row or terrace house, townhouses increased between 2021 and 2011. Increasing from 20 in 2011 and 39 in 2021. These types of homes are lived in by 2.5 per cent of the Agnes Water and 1770 population.
| Occupancy |
|
2021 % total dwellings |
2016 % total dwellings |
2011 % total dwellings |
| Total Occupied dwellings |
67.1 |
62.8 |
61.1 |
| Unoccupied private dwellings |
32.5 |
37.1 |
38.9 |

5.3 per cent of the community requires assistance with core activities, this represents 150 people.
The number of people requiring assistance has increased by 55 people in the 10 year duration between the 2011 and 2021 Census, or 57.9 per cent across the 10-year Census periods.
In addition, the number of people that have 'not stated' need for assistance has increased from 6.9 per cent in 2011 to 11.7 per cent in 2016 and 13.8 per cent in 2021.
The largest proportion of people that required assistance with core activities in 2021 was those aged 55-64, make up 22 per cent (33 people) of those that need assistance compared 22 per cent (20 people) in 2016 and 31.6 per cent (30 people) in 2011. The number of people aged 5-14 that need assistance with core activities has increased by six between 2021 and 2011.
While there is an increase in the number of people needing assistance aged 35-74 they represent a smaller percentage of the population when compared to 2021. There has been a sizable increase in those aged 75-84 needing support increasing from six people in 2011 to 20 in 2021, at the same time the number of people aged 85 and over needing assistance has increased from zero per cent of people in 2011 to three per cent or three people in 2016 moving to 4.7 per cent of seven people in 2021.
There are 251 people providing unpaid assistance to a person with a disability, health condition or due to old age which is an increase of 141 people from 2011. There is a general decrease in the percentage of the population providing support that are aged 25-64. That said 24.7 per cent of those that provide support are 55-64, followed by those aged 45-54 and 65-74.
The percentage of those that provide support aged 65- 85 and older has seen the largest increase making up 13.1 per cent (19 people) of those that provided support in 2011 compared to 25.9 per cent (65 people) in 2021.
Considerations:
- The number of people needing support is increasing.
- The age of people providing support is increasing with just over a quarter aged over 65.
|
2021 |
% |
2016 |
% |
2011 |
% |
% Change 2011- 2021 |
% Change 2016- 2021 |
% Change 2011- 2016 |
|
Has need for assistance 2021
|
150 |
5.3 |
93 |
4.1 |
95 |
5 |
57.9% |
61.3% |
-2.1% |
|
Does not have need for assistance 2021
|
2,311 |
81 |
1,917 |
84.1 |
1665 |
88.1 |
38.8% |
20.6% |
15.1% |
|
Need for assistance not stated 2021
|
395 |
13.8 |
267 |
11.7 |
130 |
6.9 |
203.8% |
47.9% |
105.4% |
Volunteering is slightly lower in the Agnes Water and 1770 communities with 454 (15.9 per cent) people aged 15 years and over providing volunteer services. This compares to 16.2 per cent for the Gladstone Region.
The number of volunteers in Agnes Water and 1770 has slightly increased over time with 359 volunteers in 2011, which increased by 84 in 2016 with 449 people volunteering. The number of volunteers increased a little further between 2021 and 2016, with 11 more people volunteering. This means Agnes Water and 1770 had an in volunteers of 95 between 2021 and 2011.
There have been changes in the percentage of population volunteering across all age brackets, with decreases across six and increases across three.
There was a 5.5 per cent reduction in the percentage of volunteers aged 35-44, which was the largest decrease between 2011 and 2021. Followed by those 45-54, with a 5.1 per cent reduction.
The biggest increases seen during this period were those aged 65-74, making up 13.9 per cent of volunteers in 2011, 15.6 per cent in 2016 and 25.1 per cent in 2021 which is an increase of 64 from 50 in 2011.
There was a 4.7 per cent increase in volunteers aged 75-84, with 10 volunteers in this age bracket back in 2011 increasing to 34 in 2021.
There are currently seven active community groups in the area, 11 community sporting groups and three large community-led destination events, the Agnes Water Blues and Roots Festival, 1770 Cultural Immersion Festival and the 1770 Festival.
Considerations:
- Volunteer numbers are increasing slightly as is the age of volunteers. If is a reduction in younger volunteers over the long term could have an impact on sustainability and viability of community groups, events and sport and recreation organisations.
Council regularly undertakes a Community Satisfaction Survey to identify community sentiment with respect to its assets, services and programs.
|
Agnes Water |
1770 |
Gladstone Region |
LGA Benchmark |
| Overall satisfaction |
56.0% |
56.0% |
55.0% |
55.7% |
|
|
|
|
|
| ASSETS |
|
|
|
|
| (1 = very dissatisfied – 100 = very satisfied) |
|
|
|
|
| Landfills and waste management facilities |
66.2% |
66.2% |
72.9% |
70.2% |
| Art Galleries and museums |
65.9% |
65.9% |
72.7% |
70.7% |
| Libraries |
74.6% |
74.6% |
79.7% |
78.0% |
| Airports and aerodromes |
63.5% |
63.5% |
70.8% |
70.1% |
| Parking facilities and street parking |
57.5% |
57.5% |
66.0% |
65.7% |
| Performing arts centres |
61.4% |
|
69.1% |
69.0% |
| Lighting and signage |
60.4% |
60.4% |
68.3% |
68.9% |
| Beaches and coastal areas |
66.4% |
66.4% |
73.1% |
73.7% |
| Landscapes and streetscapes |
61.8% |
61.8% |
69.5% |
70.1% |
| Halls and community centres |
63.4% |
63.4% |
70.7% |
72.2% |
| Stormwater and flood control system |
57.3% |
57.3% |
65.8% |
67.1% |
| Water and sewerage system |
61.8% |
61.8% |
69.4% |
71.5% |
| Boat ramps and jetties |
61.0% |
61.0% |
68.8% |
71.0% |
| Parks and open space |
65.4% |
65.4% |
72.3% |
75.0% |
| Footpaths and cycleways |
56.8% |
56.8% |
65.4% |
68.1% |
| Local roads and bridges |
53.8% |
53.8% |
63.0% |
65.8% |
| Sport and recreation facilities |
61.3% |
61.3% |
69.1% |
73.2% |
| Camping grounds and caravan parks |
55.8% |
55.8% |
64.6% |
68.9% |
| Swimming pools and aquatic centres |
52.5% |
|
62.0% |
71.5% |
| Public toilets and amenities |
|
61.4% |
69.1% |
67.7% |
|
|
|
|
|
| SERVICES |
|
|
|
|
| (1 = very dissatisfied – 100 = very satisfied) |
|
|
|
|
| Emergency and disaster management |
63.8% |
63.8% |
71.0% |
71.0% |
| Waste services |
68.1% |
68.1% |
74.5% |
74.0% |
| Customer service |
61.6% |
61.6% |
69.3% |
69.7% |
| Consulting with the community |
49.7% |
49.7% |
59.7% |
61.1% |
| Building services |
53.5% |
|
62.8% |
64.8% |
| Animal management services |
54.5% |
54.5% |
63.6% |
66.1% |
| Informing the community of council decisions |
52.1% |
52.1% |
61.7% |
64.4% |
| Financial management |
47.8% |
47.8% |
58.2% |
61.1% |
| Environmental management |
53.6% |
53.6% |
62.8% |
66.4% |
| Making and enforcing local laws |
51.2% |
51.2% |
60.9% |
64.9% |
| Advocating on behalf of the community |
49.9% |
49.9% |
59.9% |
64.2% |
| Making decisions in the best interest of the community |
46.6% |
46.6% |
57.3% |
61.5% |
| Community services |
55.5% |
55.5% |
64.4% |
69.8% |
| Planning and development approval |
47.0% |
47.0% |
57.6% |
62.5% |
| Infrastructure and property services |
49.4& |
49.4% |
59.5% |
64.8% |
| Public health services |
54.8% |
54.8% |
63.8% |
71.0% |
| Biosecurity and environmental health |
50.1% |
50.1% |
60.1% |
66.8% |
|
|
|
|
|
| INITIATIVES |
|
|
|
|
| (1: Far too little – 5: Far too much) |
|
|
|
|
| Affordable housing development |
40.7% |
40.7% |
52.5% |
49.7% |
| Community safety and crime prevention |
34.8% |
34.8% |
47.9% |
47.5% |
| Creative arts development |
49.2% |
49.2% |
59.3% |
59.2% |
| Celebration of multiculturalism |
51.1% |
51.1% |
60.9% |
61.5% |
| Festivals and events |
44.9% |
44.9% |
55.9% |
56.8% |
| Business development and support |
43.1% |
43.1% |
54.5% |
55.4% |
| Heritage conservation |
42.2% |
42.2% |
53.7% |
55.1% |
| Tourism development and promotion |
45.1% |
45.1% |
56.1% |
57.3% |
| Placemaking to create lively public spaces |
42.9% |
42.9% |
54.3% |
55.9% |
| Opportunities for people of all abilities to participate in community life |
40.4% |
40.4% |
52.3% |
53.9% |
| Grants and support for sports clubs and community organisations |
45.0% |
45.0% |
56.0% |
57.9% |
| Environmental conservation and climate change action |
43.7% |
43.7% |
55.0% |
56.8% |
| Waste minimisation and recycling |
40.3% |
40.3% |
52.2% |
54.4% |
| Children and youth development |
38.3% |
38.3% |
50.6% |
53.6% |
| Childcare |
42.7% |
42.7% |
54.1% |
57.6% |
| Skill development and networking opportunity |
38.6% |
38.6% |
50.9% |
54.5% |
| Health promotion |
40.3% |
40.3% |
52.3% |
55.8% |
| Newcomer attraction and retention |
39.7% |
39.7% |
51.8% |
55.6% |
| Aged care and accommodation |
26.6% |
26.6% |
41.3% |
50.3% |
| Celebration of First Nation culture |
|
53.0% |
62.4% |
63.3% |
Customer Service Requests
The Agnes Water and 1770 community engaged with Council on the following top 20 customer service requests from 30 June 2021 to 1 July 2022:
| Customer Service Request Type |
Amount |
| Development services enquiries |
165 |
| Request to change address / details |
94 |
| Water Meter Enquiry/Issues/Reading |
51 |
| Leak on Footpath / Road |
41 |
| New Initial / Additional Kerbside Collection Levy |
29 |
| Building & Plumbing Compliance |
26 |
| Information Request General |
21 |
| Repair / Replacement of Wheelie Bin Request |
19 |
| Tree Request and Enquiries on Council Land |
17 |
| Missed Wheelie Bin / Collection Problem |
14 |
| Overgrown / Unsightly Private Property Complaint |
13 |
| Administrative Action Complaint (AAC) |
12 |
| New Rural Street Address and Replacement Marker |
12 |
| Attack / Dangerous / Menacing Dog Incident |
11 |
| Planning Compliance |
11 |
| Drainage, Kerb, Channelling, Pipes, Gully Pits, Drains |
10 |
| Hydrant and Other Water Infrastructure Defects |
10 |
| Rates matters |
9 |
| Road Furniture (Signage/guideposts/guardrail) |
9 |
| Animal - Registration Replacement Tag |
7 |
| Unauthorised Camping / Overstay Council Property |
7 |
Rating Arrears
The Agnes Water and 1770’s socio-economic position is in lower than the Gladstone Region.The median weekly household income for Gladstone is $1,031 compared to $1,693 for the Gladstone Region.
When looking at combined data for Agnes Water and 1770 residential rate arrears are the highest amongst all nine profiles created 2021/22/23. With 489 properties in arrears as of 30 October 2021, this is eight per cent higher than 30 June 2022.
When looking at Agnes Water and 1770 independently Agnes Water had 463 residential properties in arrears at 30 October 2022, which 18.7 per cent of rateable properties. In 1770, 26 properties were in arrears, which is 19 per cent of rateable properties.
The total rateable residential property in Gladstone is 13,008. On average, 15.4 per cent of households have outstanding rate payments.
Education
Agnes Water State School
Prep – Year 6
Co-educational
183 Students (2021)
Discovery Christan College
Prep – Year 12
Co-educational
178 Students (2021)
Goora Gan Steiner School
Prep – Year 12
Co-educational
Community Facilities
Agnes Water Rural Transaction Centre
71 Springs Road
Hosts Customer Service Centre, Community and General Services for Gladstone Regional Council, Discovery Coast Area Justice of the Peace, Public Halls and Facilities, and Meetings Facilities
Childcare
Agnes Water Child Care Centre
(7.15am – 5.15pm)
Birth – School aged Children
68 Approved Places
$POA Per day
Community Groups
- Agnes Water Baptist Church
- Agnes Water Mens Shed
- Agnes Water Volunteer Wildlife Carers (Licensed) QWRC
- Agnes Water/1770 RSL Sub Branch
- Agnes Water/1770 Rural Fire Brigade
- Agnes Water Crafty Ladies
- Agnes Water Quilters
Sporting Groups
- 1770 Dragons
- 1770 Sailing Club
- Agnes Water 1770 Little Athletics
- Agnes Water Active Riders
- Agnes Water Marlins RLFC
- Agnes Warer Motocross Club
- Agnes Water Rugby League Club
- Agnes Water Tennis
- Blue Mantis Training Systems
- Xtreme Kids Club
- 1770 Bowls Club
Community-led Events
- 1770 Art Shows
- 1770 Festival
- DCTC Festivals – Agnes Blues and Rock Festival
- Cultural Immersion Festival
Parks
- NRMA Agnes Water Holidays Park
- Agnes Water Beach Holidays
- Agnes Water Eviro Camp
- Agnes Water Cenotaph
- Bush Heritage Paperback Forest Boardwalk
- Horison Kangaroo Sanctuary and Camp Ground
- Red Rock Trail
- The Reef Caravan Park
- 1770 Eco Camp
- Chinamans Beach
- Discovery Trail Lookout
- SES Grounds
- Air Sea Rescue Park
- Endeavor Park
- Tom Jeffery Park
Sports and Recreation
- Agnes Water Skate Park
- 1770 Bowls Club
- Agnes Water 1770 Little Athletics
- Agnes Water Tennis