New Auckland is a suburb of Gladstone and is in close proximity to Briffney Creek and Auckland Creek, from which the suburb takes its name.
Auckland Creek is named after the colonial ship, Lord Auckland, which was chartered by the New South Wales Government to carry some of the first settlers to Gladstone. The ship entered the harbour on 25 January 1847.
The suburb is also close to two major road networks, Kirkwood Road and the Dawson Highway.
Compared to the Gladstone Region and Queensland, New Auckland has:
- The median age of new Auckland is 33 and has increased by two between 2011 and 2021. The median age is lower than the region and State by five years.
- Cultural diversity in New Auckland increased most between 2011 and 2016. In 2021, New Auckland had a slightly higher cultural diversity than the region but lower than the State.
- Median household income is significantly higher than both the region and State.
| Data focus |
New Auckland |
Gladstone Region |
Queensland |
|
2021 |
2016 |
2011 |
Change 2021- 2011 |
Change 2021- 2016 |
Change 2016- 2011 |
2021 |
2021 |
| Median Age |
33 |
32 |
31 |
6.5% |
3.1% |
3.2% |
38 |
38 |
| Non English-speaking backgrounds |
6.00% |
5.90% |
3.00% |
100.0% |
1.7% |
96.7% |
5% |
12.6% |
| Couple Family with children |
46.60% |
49.80% |
49.70% |
-6.2% |
-6.4% |
0.2% |
41.7% |
55.4% |
| Couple Family without children |
34.50% |
35.30% |
34.00% |
1.5% |
-2.3% |
3.8% |
40.5% |
28% |
| Average number of people per household |
2.7 |
2.8 |
2.8 |
-3.6% |
-3.6% |
0.0% |
2.5 |
2.5 |
| Household with a mortgage |
39.50% |
38.00% |
21.50% |
83.7% |
3.9% |
76.7% |
37% |
34.4% |
| Households renting |
37.70% |
39.80% |
17.10% |
120.5% |
-5.3% |
132.7% |
33.4% |
33% |
| Median weekly household income |
$2,003 |
$2,021 |
$1,952 |
2.6% |
-0.9% |
3.5% |
$1,639 |
$1,675 |
| Median monthly mortgage repayments |
$1,612 |
$2,000 |
$2,019 |
-20.2% |
-19.4% |
-0.9% |
$1,600 |
$1,733 |
| Median weekly rent (overall) |
$300 |
$250 |
$300 |
0.0% |
20.0% |
-16.7% |
$275 |
$365 |
| University attendance |
7.90% |
7.80% |
6.90% |
14.5% |
1.3% |
13.0% |
7.2% |
14.2% |
In 2021, the population of New Auckland was 5,266 compared to 5,085 in 2016 and 4711 in 2011. Between 2021 and 2011 the population of New Auckland has increased by 555 people.
In 2021, the median age of the New Auckland community was 33 compared to 32 in 2016 and 31 in 2011. This is lower than the region and the State, both with a median age of 38.
There have been increases against the majority of age categories from 2011 to 2021, relating to the development of new subdivisions in the New Auckland area between 2011 and 2016.
Almost 80 per cent of the population in New Auckland is aged under 55 (78.6 per cent), and almost 60 per cent of that 80 per cent is aged under 40.
That said, the most significant increase in New Auckland was in the 85 year and older segment, increasing by 265 per cent, or 77 people. This substantial increase is the result of the New Auckland Place aged care facility that opened during the ten-year Census period.

The second largest increase in the population over the ten-year Census period (2011-2021), were in residents aged 65-69, with a 78.3 per cent increase equivalent to 83 people.
Similarly, those aged between 55 and 85 all saw significant increase in number across the age group with a 61.7 per cent increase, or 439 people.
At the other end of the age spectrum, young people aged between 5-19 also experienced an uplift across the decade, with an increase of 15 per cent across the group. The highest increase was between 10-14 years with growth of 27.3 per cent or 96 people.
The largest decrease was in the 35–39-year age group, declining by 12.9 per cent between 2011 and 2021, equivalent to 54 people. The second largest decrease was those aged 0-4, with a 7.5 per cent decrease, or 34 young people.
When analysing service level data, the trends are clear to see that the proportion of the New Auckland population that are older workers, empty nesters, retirees, seniors and the elderly has significantly increased over the decade. While the proportion of the community under 50 is more prominent, significant increases have been seen in the middle to third aged segment.
In 2021, the age groups that differ most to the Gladstone Region are:
- Almost 80 per cent of the New Auckland community is aged under 50.
- While the proportion of older workers and empty nesters and retirees is increasing, they are lower than the region.
|
New Auckland |
Gladstone Region |
Queensland |
| Age |
2021 Pop |
% pop |
2016 Pop |
% pop |
2011 pop |
% pop |
% Change 2021 - 2011 |
% Change 2021 - 2016 |
% Change 2016 - 2011 |
2021 Pop |
% pop |
2021 Pop |
% pop |
| Median age |
33 |
N/A |
32 |
N/A |
31 |
N/A |
N/A |
N/A |
N/A |
38 |
N/A |
38 |
N/A |
| 0-4 years |
417 |
7.92 |
423 |
8.3 |
451 |
9.6 |
-7.5% |
-1.4% |
-6.2% |
4,049 |
6.4 |
292,452 |
5.7 |
| 5-9 years |
400 |
7.6 |
437 |
8.6 |
377 |
8.0 |
6.1% |
-8.5% |
15.9% |
4,686 |
7.4 |
329,311 |
6.4 |
| 10-14 years |
448 |
8.51 |
380 |
7.5 |
352 |
7.5 |
27.3% |
17.9% |
8.0% |
4,913 |
7.7 |
342,560 |
6.6 |
| 15-19 years |
338 |
6.42 |
317 |
6.2 |
307 |
6.5 |
10.1% |
6.6% |
3.3% |
4,001 |
6.3 |
313,506 |
6.1 |
| 20-24 years |
343 |
6.51 |
350 |
6.9 |
358 |
7.6 |
-4.2% |
-2.0% |
-2.2% |
3,159 |
5 |
323,739 |
6.3 |
| 25-29 years |
395 |
7.5 |
418 |
8.2 |
400 |
8.5 |
-1.3% |
-5.5% |
4.5% |
3,766 |
5.9 |
347,687 |
6.7 |
| 30-34 years |
392 |
7.4 |
420 |
8.3 |
376 |
8 |
4.3% |
-6.7% |
11.7% |
4,066 |
6.4 |
354,033 |
6.9 |
| 35-39 years |
366 |
7 |
381 |
7.5 |
400 |
8.9 |
-12.9% |
-3.9% |
-9.3% |
4,280 |
6.7 |
357,120 |
6.9 |
| 40-44 years |
337 |
6.4 |
393 |
7.7 |
345 |
7.3 |
-2.3% |
-14.2% |
13.9% |
4,069 |
6.4 |
330,692 |
6.4 |
| 45-49 years |
381 |
7.2 |
360 |
7.1 |
332 |
7 |
14.8% |
5.8% |
8.4% |
4,518 |
7.1 |
340,287 |
6.6 |
| 50-54 years |
317 |
6 |
311 |
6.1 |
278 |
5.9 |
14.0% |
1.9% |
11.9% |
4,546 |
7.2 |
333,843 |
6.5 |
| 55-59 years |
323 |
6.1 |
280 |
5.5 |
217 |
4.6 |
48.8% |
15.4% |
29.0% |
4,524 |
7.1 |
316,378 |
6.1 |
| 60-64 years |
237 |
4.5 |
181 |
3.6 |
147 |
3.1 |
61.2% |
30.9% |
23.1% |
4,154 |
6.5 |
298,919 |
5.8 |
| 65-69 years |
189 |
3.6 |
123 |
2.4 |
106 |
2.3 |
78.3% |
53.7% |
16.0% |
3,190 |
5 |
264,515 |
5.1 |
| 70-74 years |
126 |
2.4 |
83 |
1.6 |
76 |
1.6 |
65.8% |
51.8% |
9.2% |
2,532 |
4 |
238,952 |
4.6 |
| 75-79 years |
90 |
1.7 |
85 |
1.7 |
72 |
1.5 |
25.0% |
5.9% |
18.1% |
1,507 |
2.4 |
168,385 |
3.3 |
| 80-84 years |
80 |
1.5 |
52 |
1 |
65 |
1.4 |
23.1% |
53.8% |
-20.0% |
886 |
1.4 |
106,611 |
2.1 |
| 85 years and over |
106 |
2 |
88 |
1.7 |
29 |
0.6 |
265.5% |
20.5% |
203.4% |
67 |
1.1 |
98,135 |
1.9 |
source ABS 2021, 2016, 2011
| Group |
Age |
New Auckland |
Gladstone Region |
|
|
2021 |
% pop |
2016 |
% pop |
2011 |
% pop |
% Change 2021- 2011 |
% Change 2021- 2016 |
% Change 2016- 2011 |
2021 |
% pop |
| Babies and pre-schoolers |
0-4 yrs |
417 |
7.9 |
423 |
8.3 |
451 |
9.6 |
-7.5% |
-1.4% |
-6.5% |
4,049 |
6.4% |
| Primary and secondary schoolers |
5-19 yrs |
1,186 |
22.5 |
1,134 |
22.3 |
1,036 |
22 |
14.5% |
4.6% |
9.5% |
13,600 |
28.8% |
| Tertiary education and independence |
20-24 yrs |
343 |
6.5 |
350 |
6.9 |
358 |
7.6 |
-4.2% |
-2.0% |
-2.2% |
3,159 |
5.0% |
| Young workforce |
25-29 yrs |
395 |
7.5 |
418 |
8.2 |
400 |
8.5 |
-1.3% |
-5.5% |
4.5% |
3,766 |
5.9% |
| Parents and home builders |
30-49yrs |
1,476 |
28 |
1,554 |
30.6 |
1,473 |
31.1 |
0.2% |
-5.0% |
5.5% |
16,933 |
26.6% |
| Older workers and retirees |
50-59 yrs. |
640 |
12.2 |
591 |
11.6 |
495 |
10.5 |
29.3% |
8.3% |
19.4% |
9,070 |
14.3% |
| Empty nesters and retirees |
60-69 yrs |
426 |
8.1 |
304 |
6 |
253 |
5.4 |
68.4% |
40.1% |
20.2% |
7,344 |
13.6% |
| Seniors |
70-84 yrs |
296 |
5.6 |
220 |
4.3 |
213 |
4.5 |
39.0% |
34.5% |
3.3% |
4,925 |
7.8% |
| Elderly aged |
85+ |
106 |
2 |
88 |
1.7 |
29 |
0.6 |
265.5% |
20.5% |
203.4% |
679 |
1.1% |
Service group breakdown compared to the Region, source ABS 2022, 2016, 2011
The communities of New Auckland have diverse household types with the main group being couples with children.
In 2021, the percentage of couple families with children was 46.6 per cent which is higher than the region at 41.7 per cent and the State 41.2 per cent.
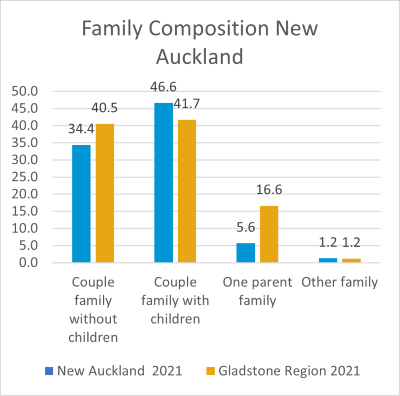
The number of couple families with children was 607 in 2011, which was 49.7 per cent of families. While in 2016 the number of families in this category increased to 663 in 2016, which represented 49.8 per cent in of families. While in 2021 there were 636 couple families with children. The proportion of the population that are couple families with children has increased by 4.8 per cent between 2011 and 2021 which equates to a slight increase of 29 people.
The number of couple families without children has fluctuated between 2011 and 2021, being 415 (34 per cent of families), 470 (353.3 per cent of families) in 2016 and 469 or 34.4 per cent of families in 2021. This equates to an increase of 54 couple families without children between 2011 and 2021.
There number of one parent families has decreased significantly between 2011 and 2021, reducing by 57.2 per cent.
One parent family represented 14.7 per cent of families in 2011, 14 per cent in 2016 and 5.6 per cent in 2021. The number of one parent families was 180 in 2011, 186 in 2016 and 77 in 2021. This equates to and overall reduction of 103 one parent families living in New Auckland between 2011 and 2021.
The number of families in New Auckland increased by 147 between 2021 and 2011.
There are 1,561 people in a registered marriage in New Auckland, which is 44.7 per cent of the population, which 2.49 per cent higher than the region at 43.6 per cent.
While higher than the region, the number of people in a registered marriage has fluctuated over time being 1,482 people (47.8 per cent of population) in 2011, increasing to 1,581 people or 48.5 per cent of the population in 2016, before decreasing slightly to 1,561 people of 44.7 per cent of the population. Between 2011 and 2021 there has been an increase of 221 people in a registered marriage, people in this category make up 3.1 per cent less of the population in 2021 compared to 2011.
The percentage of the population at are not married has also fluctuated over time. Making up 36 per cent of the New Auckland community in 2011, compared to 33.6 per cent in 2016 and 28.7 per cent in 2021. This means the proportion of the community that is not married was 2.7 per cent higher or an additional 234 people in 2021 compared to 2011.
The number of people in a de-facto marriage increased from 500 in 2011 to 583 in 2016, staying roughly static in 2021 at 581. This means that the proportion of people in a de-facto marriage increase by 16.2 per cent between 2011 and 2021.
Family composition
| New Auckland |
Gladstone Region |
Queensland |
|
2021 |
% pop |
2016 |
% pop |
2011 |
% pop |
% Change 2011 - 2021 |
% Change 2016 - 2021 |
% Change 2011 - 2016 |
2021 pop |
% pop |
2021 pop |
% pop |
| Couple family without children |
469 |
34.4 |
470 |
35.3 |
415 |
34 |
13.0% |
-0.2% |
13.3% |
6,829 |
40.5% |
551,069 |
40.3% |
| Couple family with children |
636 |
46.6 |
663 |
49.8 |
607 |
49.7 |
4.8% |
-4.1% |
9.2% |
7,021 |
41.7% |
563,327 |
41.2% |
| One parent family |
77 |
5.6 |
186 |
14 |
180 |
14.7 |
-57.2% |
-58.6% |
3.3% |
2,798 |
16.6% |
124,174 |
9.1% |
| Other family |
17 |
1.2 |
3 |
0.2 |
19 |
1.6 |
-10.5% |
466.7% |
-84.2% |
202 |
1.2% |
46707 |
3.4% |
source ABS 2022, 2016, 2011
Social Marital Status
| New Auckland |
Gladstone Region |
|
2021 |
% pop |
2016 |
% pop |
2011 |
% pop |
% Change 2011 - 2021 |
% Change 2016 - 2021 |
% Change 2011 - 2016 |
2021 |
% pop |
| Registered marriage |
1,561 |
44.7 |
1,581 |
48.5 |
1,482 |
47.8 |
5.3% |
-1.3% |
6.7% |
20,253 |
43.6% |
| De facto marriage |
581 |
16.6 |
583 |
17.9 |
500 |
16.1 |
16.2% |
-0.3% |
16.6% |
6,476 |
14.8% |
| Not married |
1,350 |
38.7 |
1,095 |
33.6 |
1,116 |
36 |
21.0% |
23.3% |
-1.9% |
16,998 |
38.8% |
source ABS 2022, 2016, 2011
In 2021, 80.5 per cent of the New Auckland population was born in Australia, compared to 79.6 per cent in the Gladstone Region.
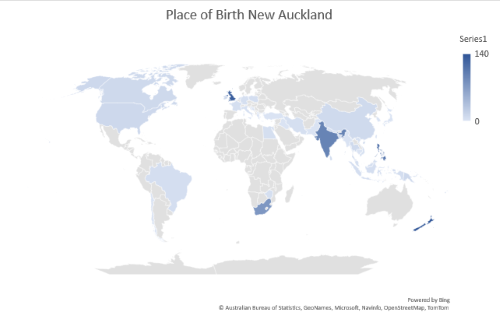
A further 7.1 per cent were born overseas from one other English-speaking country, being Canada, England, New Zealand Scotland, South Africa and the United States of America. A further 3.7 per cent did not state their country of birth.
People from non-English speaking backgrounds make up 6 per cent of the New Auckland community, with community members being born in 22 different Non-English-speaking countries.
English was the main language spoken at home, spoken by 87.1 per cent of the New Auckland population. In addition to English there were another 33 other languages spoken in 2021.
The top 10 languages spoken in 2021 were:
- 1.1% or 59 people - Other
- 1% or 51 people - Tagalog
- 0.7% or 38 people - Filipino
- 0.7% or 37 people - Hindi
- 0.6% or 29 people - Afrikaans
- 0.5% or 28 people – Malayalam
- 0.4% or 19 people - Punjabi
- 0.3% or 14 people - Tamil
- 0.2% or 13 people - French
- 0.2% or 11 people - German
In 2021, there were 265 people that did not state the language spoken at home, equating to 5 per cent of the population.
The number and percentage of the population that are Aboriginal and Torres Strait Islander people has almost doubled between 2011 and in 2021. In 2011 there were 198 Aboriginal and Torres Strait Islander people, living in New Auckland making up 4.2 per cent of the population. While in 2016 there were 222 Aboriginal and Torres Strait Islander people or 4.4 per cent of the population. In 2021, 7.3 per cent or 387 members of the New Auckland community identified as Aboriginal and Torres Strait Islander people. Meaning there were an additional 198 Aboriginal and Torres Strait Islander people living in New Auckland when compared to 2011.
The main religious followings in the New Auckland are:
- 45.2% - No religion
- 18.9% - Catholic
- 11.2% - Anglican
- 3.4% - Uniting Church
- 2.5% - Presbyterian and Reformed
- 2% - Baptist
- 1.7% - Christianity, nfd
- 1.6% - Pentecostal
- 1.5% - Hinduism
- 0.9% - Buddhism
The number of people having no religion has increased between 2011 and 2021, increasing from 26 per cent (1,227 people) in 2011 to 32.1 per cent (1,633 people) of the population in 2016. While in 2021 45.2 per cent of the population had no religious affiliation, which equates to 2,380 people.
In 2021, in addition to the 45.2 per cent of the community stating they had no religion, a further 6.6 per cent did not respond.
In 2021, there were 2,726 with no religious affiliation or did not state affiliation compared to 2,319 people that stated religious affiliation.

The main occupation categories for people aged 15 years and over in New Auckland are:
- 22.7% - Technicians and Trade Operators
- 14% - Professionals
- 12.1% - Labourers
- 11.5% - Machinery operators
- 11% - Community and personal service workers
Whilst Community and Personal Service Workers represent 11 per cent of the New Auckland community, this category has seen exponential growth of 84.3 per cent across the decade.
Minor increases have been observed in the categories of Professionals and Technicians and Trade workers of 6.5 per cent and 6.6 per cent respectively.
Clerical and administrative workers experienced the largest decrease at 9.4 per cent, or 29 people.

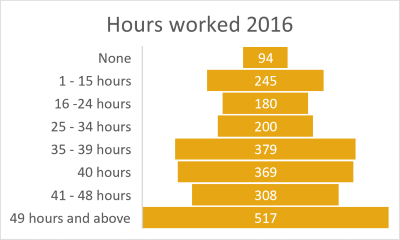
The number of people of people that worked full time decreased by 95 people between 2011 and 2021. The percentage of the population working full time decreased over this period from 48.6 per cent in 2011 to 40.9 per cent in 2016 and 40.5 per cent in 2021. This equates to a decrease of 5.5 per cent decrease in the workforce working full time.
Over the same period the number of people that worked part time increased by 218 people, from 548 people in 2016 to 626 in 2016 and 766 in 2021. This equates to a 39.7 per cent increase in the proportion of the workforce working part time when comparing 2011 and 2021 data.
The unemployment rate has significantly increased in New Auckland between 2011 and 2021. In 2011 the unemployment rate was 2.6 per cent (91 people) compared to 6.8 per cent or 261 people in 2016, before reducing to 4.8 per cent or 190 people in 2021. The unemployment rate increased by 108 per cent between 2011 and 2021, which means the number of unemployed people increased by 99 people.
There has been a 36.5 per cent increase in the percentage of the population not in the workforce between 2011 and 2021, the equivalent of 282 people. The number of people not in the workforce in 2021 and 2016 remained roughly static in 2021 and 2016, which was 1,057 and 1,029.
In 2021, the top five ranked industries were manufacturing at 15.6 per cent followed by retail trade at 10.9 per cent, in third place was Health and Social Assistance 10.6 per cent, while in fourth construction at 10.3 followed by transport, postal warehousing in fifth at 8.4 per cent.

It is worth noting that those working in the health care and assistance has seen the largest increase across all industries. Making up 5.3 per cent of the workforce in 2011. 7.7 per cent in 2016 and 10.6 per cent in 2021, an increase of 111.7 per cent.
In 2021 63.3% of the workforce worked more than 35 hours week which is 2.7% increase from 2016.
Data from the 2021 census shows 94.6 per cent of workers travel to their place of work by car, either as driver or passenger.
Considerations:
- There is a large proportion on people working over 35 hours per week. Consideration to be given around the accessibility and timing of events, activities and programs
New Auckland has a higher socio-economic profile than the Gladstone Region.
- The median weekly household income is $2,003 compared to $1,693 for the Gladstone Region.
- 29.1% of households earn $3,000 or more per week compared to 25.3% for the Gladstone Region.
- 4.8% households earn less than $650 each week compared to 7.2% for Gladstone Region.
- 31.7% of non-family households earn less than $650 each week which is higher than the Region at 47.2%.
In 2021, 20 per cent of households fully owned their home which was 26.7 per cent lower than the Gladstone Region at 27.3 per cent. The number of households that owned their home outright was 357 in 2021, 282 in 2016 and 246 in 2011. Representing 19.5 per cent, 16.8 per cent and 7.9 per cent of households. This equates to an overall increase of 45.1 per cent or 111 more households that own their home outright when comparing 2011 and 2021.

The population that owns their home with a mortgage increased by 52 households between 2011 and 2021. Increasing from 21.5 per cent of households is in 2011, to 38 per cent in 2016, and 39.5 per cent in 2021. This represents an 83 per cent increase of households that own their home with a mortgage in 2021 when compared to 2011.
Median mortgage payments decreased in New Auckland between 2011 and 2021. Average monthly mortgage payments were $1,612 in 2021 which is $12 higher than the Gladstone Region and is $122 lower than the State, which has a median payment of $1,733. In 2016, median mortgage payments were $2,000, while in 2011 they were $2,019. There was an overall reduction in mortgage payments of $407 between 2011 and 2021.
Data has changed across all mortgage payment brackets; with a general trend of lower price points $1,799 and under and increase in higher price points $1,800 and over.
The two largest decreases were most noticeable in those paying $1,800-$2,399 and $2,400-$2,999. There was a 23.7 per cent reduction in the proportion of households paying between $1,800-$2,399 and 44.8 per cent reduction of households paying between $2,400-$2,999.
The largest two increases across the decade were seen in those paying $1,000-$1,399 and $1,400-$1,799, with increases of 93.6 per cent and 73.1 per cent respectively.
There is a higher percentage of the population renting in New Auckland compared to the Gladstone Region. In 2021, 37.7 per cent of households rented in New Auckland compared 33.9 per cent in the region which is 11.2 per cent increase.
In 2011, 17.1 per cent of New Auckland Households rented, compared to 39.8 per cent in in 2016 and 2021. This equated to 532 households in 2011, 668 in 2016 and 689 in 2021.
The largest increase was seen in the number of households renting from a real estate being 303 in 2011, 509 in 2016 and 519 in 2021. Increasing from 9.7 per cent of households in 2011, 30.4 per cent in 2016 and 28.4 per cent in 2021.
While there have been increases in those renting from real estate, the number of people renting from a state housing authority has fluctuated over time, resulting in an overall decrease. In 2011, 115 households rented from state housing authority, this reduced to 76 in 2016 and 70 in 2021.
The number of people renting from a community housing provider was 32 in 2011, 5 in 2016 and 12 in 2021.
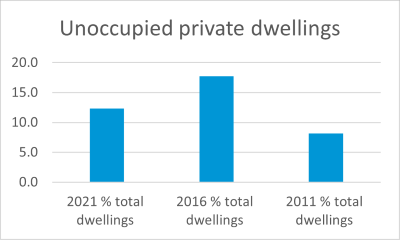
87.8 per cent dwellings are occupied in New Auckland compared with 85 per cent in the Gladstone Region.
The proportion of occupied dwellings fluctuated over time, with a 10.3 per cent reduction in occupied dwellings between 2011 and 2016. Between 2016 and 2021 the proportion of occupied dwellings increased by 6.6 per cent. While there has been a 4.3 per cent decrease in the proportion of dwellings in 2021 compared to 2011 there are 277 more occupied dwellings.
In 2011, there were 138 unoccupied dwellings, while in 2016 this increased to 359. In 2021, this reduced to 257, meaning there were 119 more unoccupied dwellings in 2021 compared to 2011.
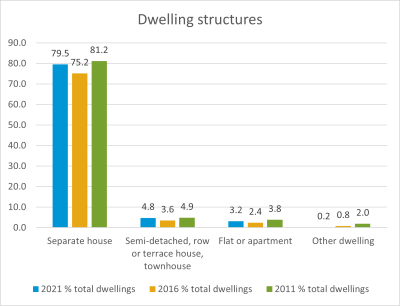
Most of the housing in the New Auckland is separate houses at 79.5 per cent which is 6.8 per cent higher than the Gladstone Region.
Considerations:
- There is a sizable number of properties that are unoccupied in New Auckland, which could provide an opportunity to help with current housing challenges within the region.
| Occupancy |
|
2021 % total dwellings |
2016 % total dwellings |
2011 % total dwellings |
| Total occupied dwellings |
87.8 |
82.3 |
91.8 |
| Unoccupied private dwellings |
12.3 |
17.7 |
8.2 |

7.3 per cent of the community requires assistance with core activities, this represents 387 people.
The number of people requiring assistance with core activities has increased from 167 people in 2011 to 290 in 2016 and 387 in 2021. This represents a significant increase of 131.7 per cent in the proportion of the community that requires assistance between 2011 and 2021.
In addition, the number of people that have 'not stated' a need for assistance has decreased mostly over time from 6.4 per cent (303 people) in 2011 to 6.5 per cent (328 people) in 2016, before reducing to 4.7 per cent (250 people) in 2021.
The largest proportion of people that required assistance with core activities in 2021 was those aged 75-84, 85+ and those aged 5-14. Those aged 85 and over, represented 21.2 per cent of those needing care or 82 people. While community members aged 75-84 represented 17.1 per cent (66 people) of those needing support in 2021. People aged 5-14 represented 15 per cent of community members needing support or 58 people.
There were changes across all age brackets between 2021 and 2011, the largest increase was seen in the number of people needing support aged 85 and over. Increasing from 16 (6.9 per cent of people needing support) in 2011 to 71 (24 per cent of people needing support) 2016, increasing to 82 people or 21.2 per cent of those needing support in 2021. The second largest increase was seen in the number of people aged 5-14 that need support with core activities, increasing from 13 people (7.8 per cent of those needing support) to 28 people or 10 per cent of those needing support in 2016 compared to 58 people or of 15 per cent of community members needing support.
There are 369 people providing unpaid assistance to a person with a disability, health condition or due to old age in the New Auckland area. There has been an increase of 87 people providing unpaid assistance between 2021 and 2011.
Over 60 per cent of community members providing unpaid assistance to a person with a disability health condition or due to old age in New Auckland are aged 35-64. In addition, those aged 55-64 make up 22.8 per cent of community members that provide assistance alongside the 21.4 per cent aged 35-44 and those aged 45-54 which make up 20.9 per cent of those providing assistance.
Considerations:
- The age of the population needing support is increasing as is the age of those providing support. Consideration needs to be given to the types of services, programs and activities that are needed.
- New Auckland has a diverse community and consideration needs to be given to social planning and culturally appropriate services for the ageing community.
- There is an increasing proportion of the community that need assistance. Consideration should be given to how this section of the community can be actively involved in the design of buildings, places and services to ensure the gold standard of accessibility.
|
2021 |
% |
2016 |
% |
2011 |
% |
% Change 2011- 2021 |
% Change 2016- 2021 |
% Change 2011- 2016 |
| Has need for assistance 2021 |
387 |
7.3 |
290 |
5.7 |
167 |
3.5 |
131.7 |
33.4 |
73.6 |
| Does not have need for assistance 2021 |
4,631 |
87.9 |
4,469 |
87.9 |
4241 |
90.0 |
9.2% |
3.6 |
5.3% |
| Need for assistance not stated 2021 |
250 |
4.7 |
328 |
6.5 |
303 |
6.4 |
17.4 |
23.7 |
8.2% |
Volunteering is slightly lower than the region in New Auckland with 560 people aged 15 years and over providing volunteer services, which is equal to 14 per cent of the community. This compares to 16.2 per cent for the Gladstone Region.
The number of volunteers has decreased between 2021 and 2011. In 2011 the number of volunteers was 662 (18.8 per cent volunteer rate), compared to 913 in 2016 (23.8 per cent volunteer rate), decreasing to 560 people in 2021 or a 14 per cent volunteer rate. There has been a net decrease in the number of volunteers in New Auckland between 2021 and 2011 of 102.
There are currently seven active community groups in the area, five community sporting groups.
Council regularly undertakes a Community Satisfaction Survey to identify community sentiment with respect to its assets, services and programs.
|
New Auckland |
Gladstone Region |
LGA Benchmark |
| Overall satisfaction |
56.0% |
55.0% |
55.7% |
|
|
|
|
| ASSETS |
|
|
|
| (1 = very dissatisfied – 100 = very satisfied) |
|
|
|
| Landfills and waste management facilities |
66.2% |
72.9% |
70.2% |
| Art Galleries and museums |
65.9% |
72.7% |
70.7% |
| Public toilets and amenities |
61.4% |
69.1% |
67.7% |
| Libraries |
74.6% |
79.7% |
78.0% |
| Airports and aerodromes |
63.5% |
70.8% |
70.1% |
| Parking facilities and street parking |
57.5% |
66.0% |
65.7% |
| Performing arts centres |
61.4% |
69.1% |
69.0% |
| Lighting and signage |
60.4% |
68.3% |
68.9% |
| Beaches and coastal areas |
66.4% |
73.1% |
73.7% |
| Landscapes and streetscapes |
61.8% |
69.5% |
70.1% |
| Halls and community centres |
63.4% |
70.7% |
72.2% |
| Stormwater and flood control system |
57.3% |
65.8% |
67.1% |
| Water and sewerage system |
61.8% |
69.4% |
71.5% |
| Boat ramps and jetties |
61.0% |
68.8% |
71.0% |
| Parks and open space |
65.4% |
72.3% |
75.0% |
| Footpaths and cycleways |
56.8% |
65.4% |
68.1% |
| Local roads and bridges |
53.8% |
63.0% |
65.8% |
| Sport and recreation facilities |
61.3% |
69.1% |
73.2% |
| Camping grounds and caravan parks |
55.8% |
64.6% |
68.9% |
| Swimming pools and aquatic centres |
52.5% |
62.0% |
71.5% |
|
|
|
|
| SERVICES |
|
|
|
| (1 = very dissatisfied – 100 = very satisfied) |
|
|
|
| Emergency and disaster management |
63.8% |
71.0% |
71.0% |
| Waste services |
68.1% |
74.5% |
74.0% |
| Customer service |
61.6% |
69.3% |
69.7% |
| Consulting with the community |
49.7% |
59.7% |
61.1% |
| Building services |
53.5% |
62.8% |
64.8% |
| Animal management services |
54.5% |
63.6% |
66.1% |
| Informing the community of council decisions |
52.1% |
61.7% |
64.4% |
| Financial management |
47.8% |
58.2% |
61.1% |
| Environmental management |
53.6% |
62.8% |
66.4% |
| Making and enforcing local laws |
51.2% |
60.9% |
64.9% |
| Advocating on behalf of the community |
49.9% |
59.9% |
64.2% |
| Making decisions in the best interest of the community |
46.6% |
57.3% |
61.5% |
| Community services |
55.5% |
64.4% |
69.8% |
| Planning and development approval |
47.0% |
57.6% |
62.5% |
| Infrastructure and property services |
49.4% |
59.5% |
64.8% |
| Public health services |
54.8% |
63.8% |
71.0% |
| Biosecurity and environmental health |
50.1% |
60.1% |
66.8% |
Rating Arrears
The New Auckland socio-economic position is higher than the Gladstone Region. The median weekly household income for New Auckland is $2,003 compared to $1,693 for the Gladstone Region. With 2,152 rateable residential properties and 96 commercial properties.
New Auckland had 326 residential properties in arrears as at 30 October 2022 this equated to 15.1 per cent of residential properties that were in arrears.
There was one rateable commercial property in arrears at 30 June 2022 which was one per cent of rateable properties. This number increased to three as 30 October 2022.
The total rateable residential properties in Gladstone is 13,008. On average, 15.4 per cent of households have outstanding rate payments.
Education
There are no schools in the New Auckland suburb.
Community Facilities
There are no Community Facilities directly in the New Auckland suburb.
Childcare
Good Start Early Learning Centre Gladstone Beak Street
1 Beak Street
Nursery – Kindergarten
Operating 6am-6pm Monday-Friday
Up to $122.50 per day
Vacancies Available
Community Groups
- Aspergers Austism Support Group
- Gladstone Cake Decorators Group
- Gladstone Country Music Group
- Gladstone Ukeleles (Gukes)
- Home Church
- St Peters Plays Group
- Zonta Club of Gladstone Inc
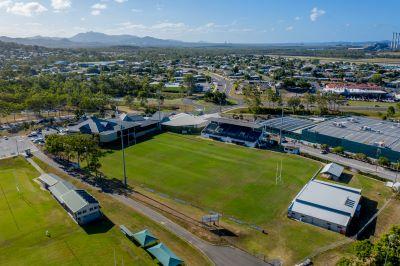
Sporting Groups
- Gladstone Judo Club
- Gladstone MTB (Mountain Bike) Club
- United Soccer Club
- Valleys Junior Rugby Club
Community-led Events
There are no community led events for New Auckland.
Parks
- Kaleentha Park
- Cockatoo Park
- Viewpoint Way Park
- Lorikeet Park
- The Outlook Playground
Sport & Recreation