
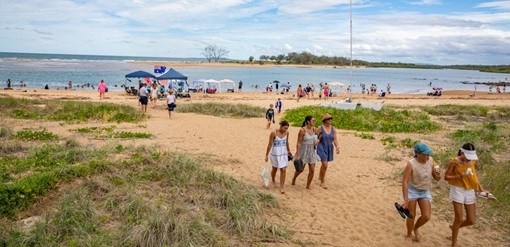
A short drive south from Gladstone is the picturesque coastal communities of Boyne Island and Tannum Sands. Boyne Island and Tannum Sands residents have a relaxed coastal lifestyle centred on superb beaches, riverside walkways, parklands and recreational activities.
With a population of close to 10,000, these ‘twin’ communities are linked by a bridge across the beautiful Boyne River. Boyne Island offers a quality mix of residential, business, shopping, industry and environment where foreshore parks overlook boats, outrigger crews and fishing on the calm river waters.
The Island is also home to Australia’s largest Aluminium Smelter operated by Rio Tinto and employs 1,300 people to produce up to 558,000 tonnes of aluminium per year.
Observations
- A median age in line with the region and State, which is slowly increasing.
- Slightly lower cultural diversity than Gladstone and significantly lower than the State.
- Higher proportion of couples with children than the region but lower than the State.
- Households have a higher income that the region and State with negligible change over the last five years.
- Higher number of households owned with a mortgage than the region and State which has decreased over the last 10 years.
- Slightly higher proportion of people attending university than the region but significantly lower than the State.
Compared to the Gladstone Region and Queensland, the towns of Boyne Island and Tannum Sands has:
| Data focus |
Boyne Tannum |
|
|
|
Gladstone Region |
Queensland |
|
2021 |
2016 |
2011 |
Change 2021- 2011 |
Change 2021- 2016 |
Change 2016- 2011 |
2021 |
2021 |
| Median Age |
39 |
36 |
35 |
4 years |
3 years |
1 year |
38 |
38 |
| Non English-speaking backgrounds |
3.7% |
4.1% |
4% |
-0.3% |
-0.4% |
0.1% |
5% |
12.6% |
| Couple Family with children |
44.1% |
50.4% |
53.8% |
-18.0% |
-12.5% |
-6.3% |
41.7% |
55.4% |
| Couple Family without children |
41.2% |
36.7% |
35.3% |
16.7% |
12.2% |
3.9% |
40.5% |
28% |
| Average number of people per household |
2.6 |
2.7 |
2.9 |
-10.3% |
-3.7% |
-6.8% |
2.5 |
2.5 |
| Household with a mortgage |
39.6% |
42.1% |
44.5% |
-11.0% |
-5.9% |
-5.3% |
37% |
34.4% |
| Households renting |
30.1% |
29.9% |
25.8% |
16.6% |
0.2% |
4.1% |
33.4% |
33% |
| Median weekly household income |
$1,948 |
$1,947 |
$2,063 |
-$115
(-5.5%) |
$1
(-0.05%) |
-$116
(-5.6%) |
$1,639 |
$1,675 |
| Median monthly mortgage repayments |
$1,733 |
$2,058 |
$2,167 |
-$434
(-20.0%) |
-$325
(-15.7%) |
-$109
(-5.0%) |
$1,600 |
$1,733 |
| Median weekly rent (overall) |
$300 |
$200 |
$360 |
-$60
(-16.6%) |
$100
(50.0%) |
-$160
(-44.4%) |
$275 |
$365 |
| University attendance |
7.8% |
6.9% |
5.4% |
44.4% |
13.0% |
27.7% |
7.2% |
14.2% |
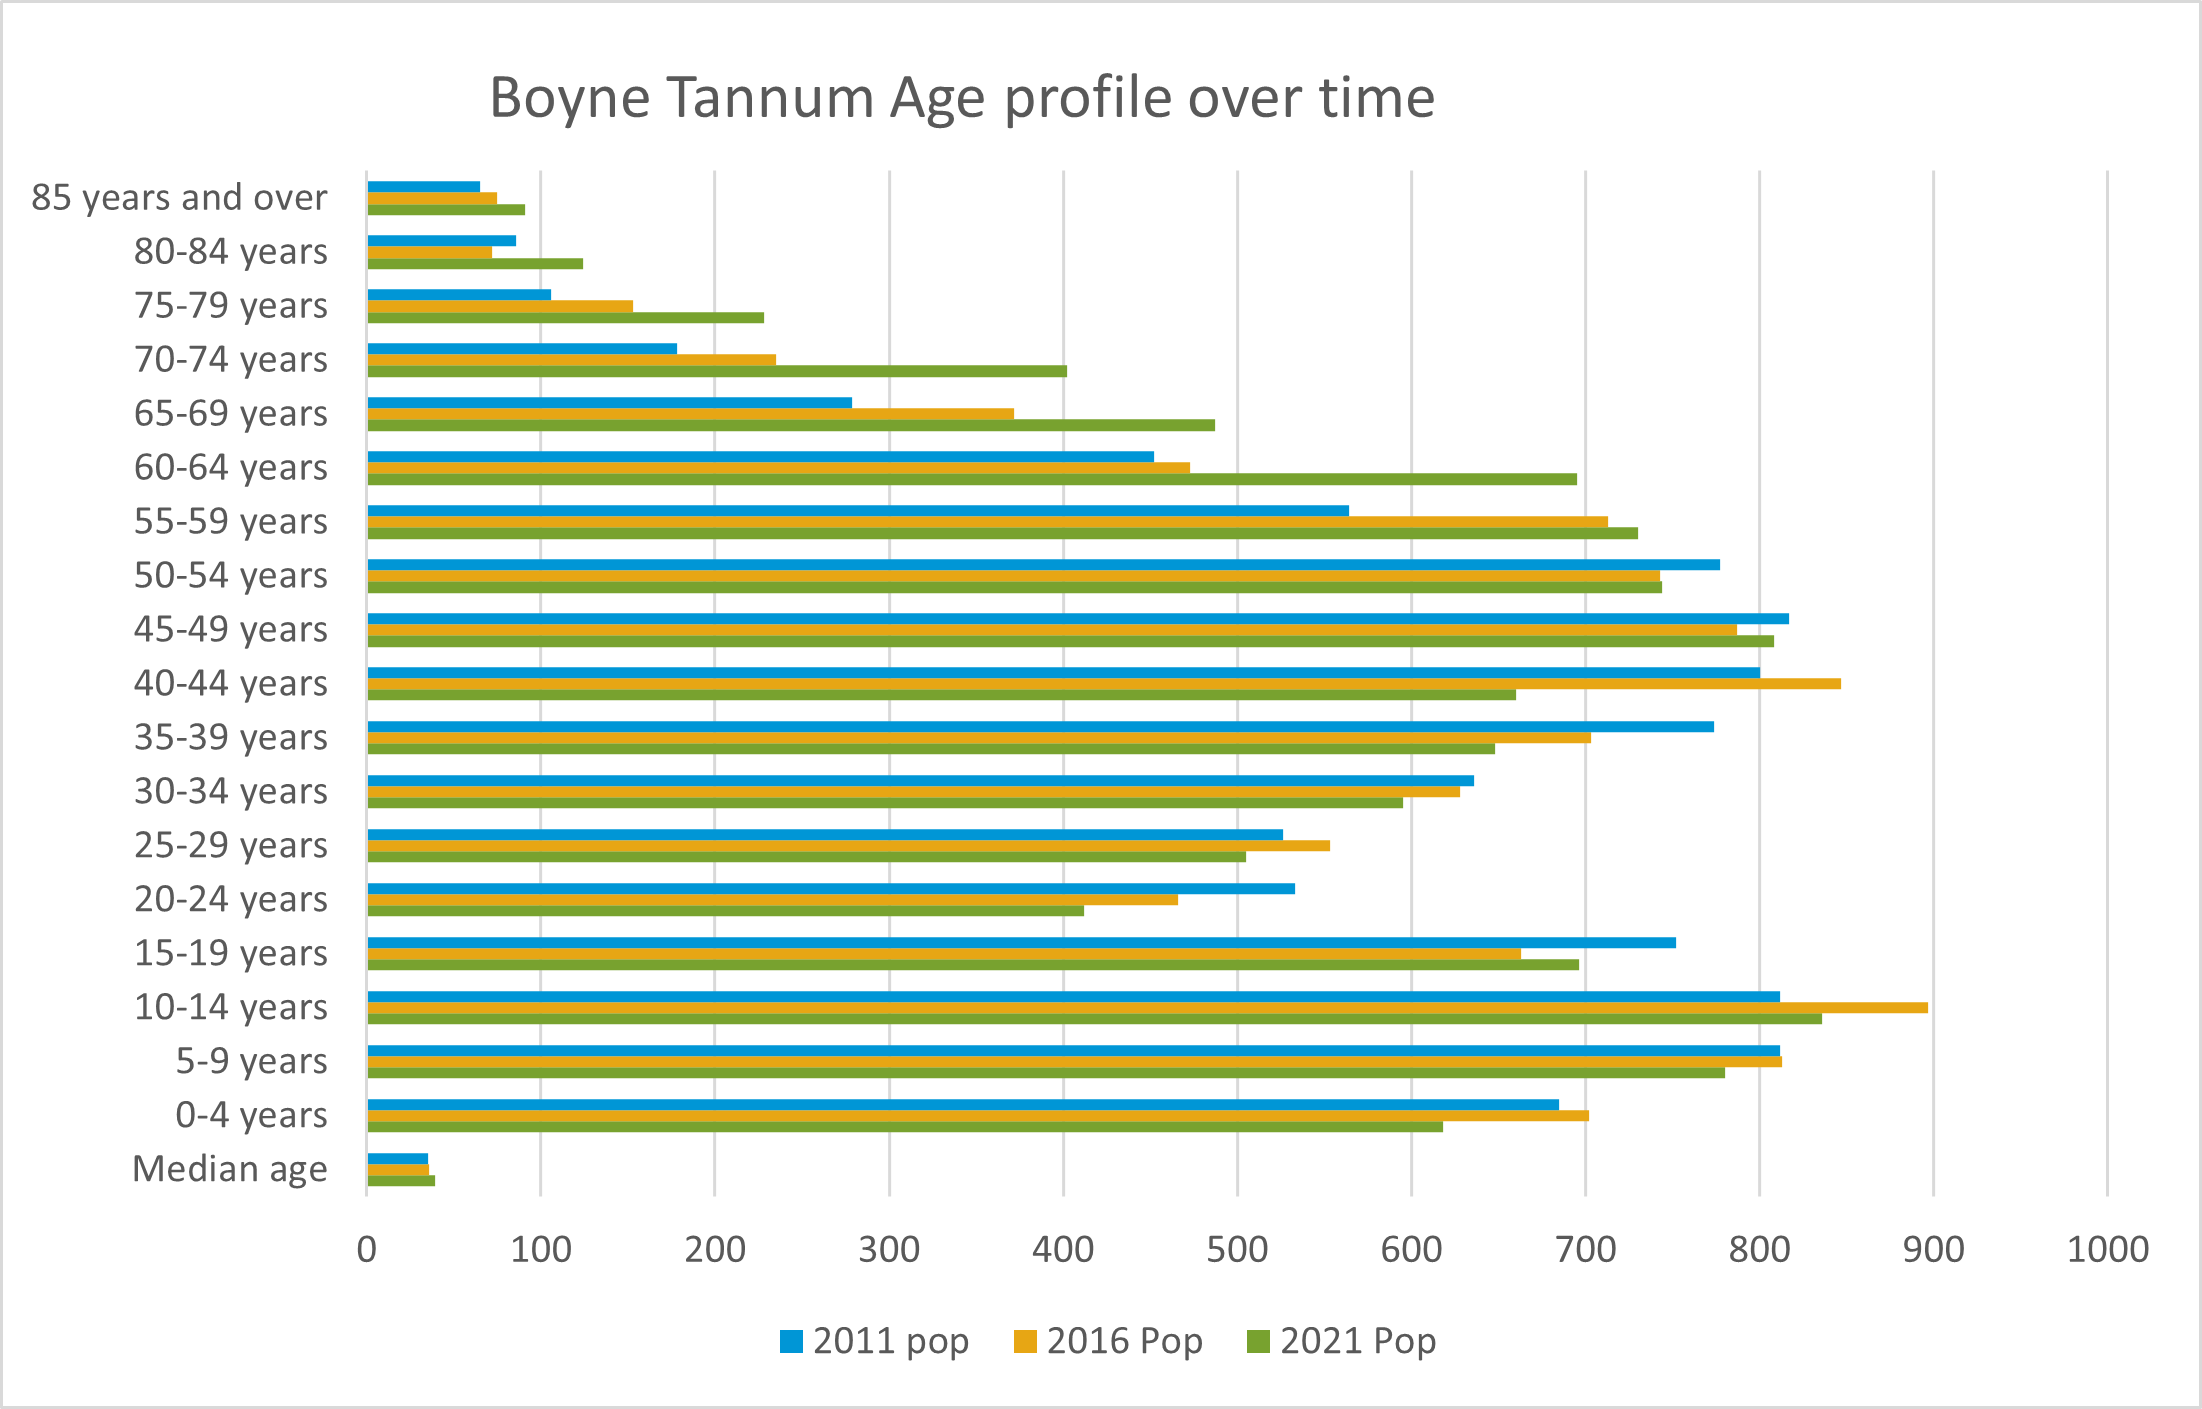
In 2021 the communities of Boyne Tannum had a population of 10,059, which is an increase of 405 since 2011, with the largest increase taking place between 2021 and 2016 at 241 people. It is estimated that the population will increase by a further 3,090 people to 12,991 by 2041, with the Retirement (65-79) age cohort forecasted to experience the largest increase (REMPLAN population forecast).
In 2021 the median age for Boyne Island and Tannum Sands was 39, which is consistent with Gladstone Region median age of 38 and the Queensland median age of 38.
Since 2011 the median age of the Boyne Tannum community has increased from 35 to 39 years of age.
The Boyne Island and Tannum Sands communities are diverse across age groups with people living in the area until their senior years.
There is a general trend with a decrease in the community aged zero to four years old to 50-54 years old and an increase of those aged 55-85 years and older. The most notable decrease is those aged 35-44 years old, with a decrease of 266 people between 2021 and 2011. There are notable increases of 963 people across all age brackets between the ages of 55-79 years old.
This could indicate the coastal area of Boyne Tannum could be a popular retirement region.
In 2021 the age groups that differ most to the Gladstone Region are:
- There has been an increase in older workers and retiree’s at Boyne Tannum – 50-59 years with an increase of 9.9 per cent (133 people) and empty nesters and retiree's increasing by 61.6 per cent (451 people) between 2011 and 2021.
- The most significant increase is the Senior's population (70-84) with a 103.7 per cent increase (384 people).
- There is generally a high proportion of people in these age brackets when compared the region.
- Families are well represented in Boyne Tannum, however, there has been a decrease in babies and pre-schoolers between 2016 and 2021 of 11.9 per cent (84 people), the percentage of people in this bracket is still line with the region at 6.1 per cent and 6.4 per cent of the population.
- There has been a decrease in parents and home builders, which has been steadily declining over the decade. In 2021, this population segment represented 2,711 people, a 10.4 per cent decline (316 people) since 2011. The age bracket is still comparable to the region at 26.9 per cent compared 26.6 per cent of the population.
- The largest decrease in the Boyne Tannum area is of primary and secondary school aged people between 2011 and 2021 of 1,064 people, a decrease of 31.5 per cent. As a percentage of the population, this age group represents 23 per cent in Boyne Tannum which is less than the regional comparison of 28.8 per cent.
There will continue to be demand for diverse services and activity opportunities to cater for all age groups in the community. This includes sport and recreation facilities, library services, community centres, education activities and programs, volunteer services, childcare and continued strong linkages with schools and various other services.
Whilst there has been a decrease in primary and secondary school children, the age group between 0-19 years represents almost 30 per cent of the Boyne Island Tannum Sands population. There will be a need for services to support primary and secondary school children, such as play spaces, sport and recreation infrastructure, arts and culture opportunities, and a range of childcare services.
Programming and infrastructure planning should also consider that families represent 56 per cent of the population.
It will be important to middle aged and ageing adults to remain healthy, active, valued and independent as they age.
There has also been a significant increase in the senior demographic, with 103 per cent growth over the decade. This data may indicate that residents in this coastal community are ageing in place, and consideration should be made for increased access to health services or retirement living precincts.
|
Boyne Island - Tannum Sands |
Gladstone Region |
Queensland |
| Age |
2021 Pop |
% pop |
2016 Pop |
% pop |
2011 pop |
% pop |
% Change 2021 - 2011 |
% Change 2021 - 2016 |
% Change 2016 - 2011 |
2021 Pop |
% pop |
2021 Pop |
% pop |
| Median age |
39 |
N/A |
36 |
N/A |
35 |
N/A |
4 years (11.4%) |
3 years (8.3%) |
1 year (2.8%) |
38 |
N/A |
38 |
N/A |
| 0-4 years |
618 |
6.1 |
702 |
7.1 |
685 |
7.1 |
-9.7% |
-11.9% |
2.4% |
4,049 |
6.4 |
292,452 |
5.7 |
| 5-9 years |
780 |
7.8 |
813 |
8.2 |
812 |
8.4 |
-3.9% |
-4.0% |
0.1% |
4,686 |
7.4 |
329,311 |
6.4 |
| 10-14 years |
836 |
8.3 |
897 |
9.1 |
812 |
8.4 |
2.9% |
-6.8% |
10.4% |
4,913 |
7.7 |
342,560 |
6.6 |
| 15-19 years |
696 |
6.9 |
663 |
6.7 |
752 |
7.8 |
-7.4% |
4.9% |
-11.8% |
4,001 |
6.3 |
313,506 |
6.1 |
| 20-24 years |
412 |
4.1 |
466 |
4.7 |
533 |
5.5 |
-22.7% |
-11.5% |
-12.5% |
3,159 |
5 |
323,739 |
6.3 |
| 25-29 years |
505 |
5 |
553 |
5.6 |
526 |
5.4 |
-3.9% |
-8.6% |
5.1% |
3,766 |
5.9 |
347,687 |
6.7 |
| 30-34 years |
595 |
5.9 |
628 |
6.3 |
636 |
6.6 |
-6.4% |
-5.2% |
-1.2% |
4,066 |
6.4 |
354,033 |
6.9 |
| 35-39 years |
648 |
6.4 |
703 |
7.1 |
774 |
8 |
-16.2% |
-7.8% |
-9.1% |
4,280 |
6.7 |
357,120 |
6.9 |
| 40-44 years |
660 |
6.6 |
847 |
8.6 |
800 |
8.3 |
-17.5% |
-22.0% |
5.8% |
4,069 |
6.4 |
330,692 |
6.4 |
| 45-49 years |
808 |
8 |
787 |
8 |
817 |
8.5 |
-1.1% |
2.6% |
-3.6% |
4,518 |
7.1 |
340,287 |
6.6 |
| 50-54 years |
744 |
7.4 |
743 |
7.5 |
777 |
8 |
-4.2% |
0.1% |
-4.3% |
4,546 |
7.2 |
333,843 |
6.5 |
| 55-59 years |
730 |
7.3 |
713 |
7.2 |
564 |
5.8 |
29.4% |
2.3% |
26.4% |
4,524 |
7.1 |
316,378 |
6.1 |
| 60-64 years |
695 |
6.9 |
473 |
4.8 |
452 |
4.7 |
53.7% |
46.9% |
4.6% |
4,154 |
6.5 |
298,919 |
5.8 |
| 65-69 years |
487 |
4.8 |
372 |
3.8 |
279 |
2.9 |
74.5% |
30.9% |
33.3% |
3,190 |
5 |
264,515 |
5.1 |
| 70-74 years |
402 |
4 |
235 |
2.4 |
178 |
1.8 |
125.8% |
71.0% |
32.0% |
2,532 |
4 |
238,952 |
4.6 |
| 75-79 years |
228 |
2.3 |
153 |
1.5 |
106 |
1.1 |
115.0% |
49.0% |
44.3% |
1,507 |
2.4 |
168,385 |
3.3 |
| 80-84 years |
124 |
1.2 |
72 |
0.7 |
86 |
0.9 |
44.1% |
72.2% |
16.2% |
886 |
1.4 |
106,611 |
2.1 |
| 85 years and over |
91 |
0.9 |
75 |
0.8 |
65 |
0.7 |
40.0% |
21.3% |
15.3% |
679 |
1.1 |
97,140 |
1.9 |
| TOTAL |
10,059 |
|
9,895 |
|
9,654 |
|
|
|
|
63,525 |
|
5,156,130 |
|
source ABS 2021, 2016, 2011
| Group |
Age |
Boyne Tannum |
Gladstone Region |
|
|
2021 |
% pop |
2016 |
% pop |
2011 |
% pop |
% Change 2021- 2011 |
% Change 2021- 2016 |
% Change 2016- 2011 |
2021 |
% pop |
| Babies and pre-schoolers |
0-4 yrs |
618 |
6.1 |
702 |
7.10% |
685 |
7.1 |
-9.7% |
-11.9% |
2.4% |
4,049 |
6.4% |
| Primary and secondary schoolers |
5-19 yrs |
2,312 |
23.0% |
2,373 |
24.0% |
3,376 |
24.6% |
-31.5% |
-2.5% |
-29.7% |
13,600 |
28.8% |
| Tertiary education and independence |
20-24 yrs |
412 |
4.1% |
466 |
4.7% |
553 |
5.5% |
-25.4% |
-11.5% |
-15.7% |
3,159 |
5.0% |
| Young workforce |
25-29 yrs |
505 |
5.0% |
533 |
5.6% |
526 |
5.4% |
-3.9% |
-5.2% |
1.3% |
3,766 |
5.9% |
| Parents and home builders |
30-49yrs |
2,711 |
26.9% |
2,965 |
30.0% |
3,027 |
31.3% |
-10.4% |
-8.5% |
-2.0% |
16,933 |
26.6% |
| Older workers and retirees |
50-59 yrs. |
1,474 |
17.7% |
1,456 |
14.7% |
1,341 |
13.9% |
9.9% |
1.2% |
8.5% |
9,070 |
14.3% |
| Empty nesters and retirees |
60-69 yrs |
1,182 |
11.7% |
845 |
8.5% |
731 |
7.6% |
61.6% |
39.8% |
15.5% |
7,344 |
13.6% |
| Seniors |
70-84 yrs |
754 |
7.5% |
460 |
4.6% |
370 |
3.8% |
103.7% |
63.9% |
24.3% |
4,925 |
7.8% |
| Elderly aged |
85+ |
75 |
0.8% |
75 |
0.8% |
86 |
0.9% |
-12.7% |
0.0 |
-12.7% |
679 |
1.1% |
Service group breakdown compared to the Region, source ABS 2022, 2016, 2011
The Boyne Tannum community has diverse household types with the main groups being couples with children and couples without children.
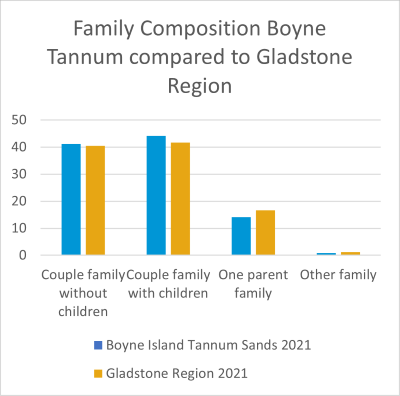
There is a higher percentage of couple families with children in Boyne Tannum representing 44.1 per cent of the population in comparison to 41.7 per ent in the Gladstone Region, and slightly higher than the State 41.2 per cent.
One parent family represent 14.1 per cent of the community and has had a significant increase of 49.8 per cent (131 families) since the 2011 census. This sector remains lower than the region, with one parent families representing 16.6 per cent of the region.
People in a registered marriage make up 50.7 per cent (3,563 people) of Boyne Tannum Community in 2021, which is higher compared to the Gladstone Region at 43.6 per cent.
Across the decade there has been an increase in de facto marriages of 13.2 per cent, and a 21.4 per cent increase in couples not married.
In 2016, 53 percent of children aged four and five in the Boyne Island and Tannum Sands (SA2) were attending preschool.
Of the 53 per cent of children attending preschool in 2016, 73 per cent were attending for 15 hours or more.
Considerations:
- With an increase of almost 50 per cent in single parent families, consideration should be given to timing of programming, and the availability of occasional and casual childcare.
- A balance in program design should also be considered to accommodate for families with children, and couples without children.
Family composition
| Boyne Island Tannum Sands |
Gladstone Region |
Queensland |
|
2021 |
% pop |
2016 |
% pop |
2011 |
% pop |
% Change 2011 - 2021 |
% Change 2016 - 2021 |
% Change 2011 - 2016 |
2021 pop |
% pop |
2021 pop |
% pop |
| Couple family without children |
1,147 |
41.2% |
982 |
36.7% |
912 |
35.3% |
25.7% |
16.8% |
7.6% |
6,829 |
40.5% |
551,069 |
40.3% |
| Couple family with children |
1,228 |
44.1% |
1,348 |
50.4% |
1,389 |
53.8% |
-11.5% |
-8.9% |
-2.9% |
7,021 |
41.7% |
563,327 |
41.2% |
| One parent family |
394 |
14.1% |
321 |
12% |
263 |
10.2% |
49.8% |
22.7% |
22.0% |
2,798 |
16.6% |
124,174 |
9.1% |
| Other family |
21 |
0.8% |
23 |
0.9% |
19 |
0.7% |
10.5% |
-8.6% |
21.0% |
202 |
1.2% |
46707 |
3.4% |
source ABS 2022, 2016, 2011
Social Marital Status
| Boyne Island Tannum Sands |
Gladstone Region |
|
2021 |
% pop |
2016 |
% pop |
2011 |
% pop |
% Change 2011 - 2021 |
% Change 2016 - 2021 |
% Change 2011 - 2016 |
2021 |
% pop |
| Registered marriage |
3,563 |
50.7% |
3,556 |
54.2% |
3,540 |
54.9% |
0.6% |
-0.9% |
0.4% |
20,253 |
43.6% |
| De facto marriage |
1,036 |
14.7% |
923 |
14.1% |
915 |
14.2% |
13.2% |
12.2% |
0.8% |
6,476 |
14.8% |
| Not married |
2,426 |
34.5% |
2,083 |
31.7% |
1,997 |
31.0% |
21.4% |
16.4% |
4.3% |
16,998 |
38.8% |
source ABS 2022, 2016, 2011
Children attending Preschool
| Year |
15 hours or moere |
Less than 15 hours |
| 2016 |
114 |
41 |
| 2017 |
124 |
58 |
| 2018 |
116 |
49 |
| 2019 |
143 |
37 |
Source, Gladstone Region engaging in action Together Data Hub, 2022

In 2021, 80 per cent of the Boyne Island and Tannum Sands population was born in Australia, compared to 79.6 per cent in the Gladstone Region.
A further 1.7 per cent were born overseas from other English-speaking countries including, Canada, England, Ireland New Zealand, South Africa, Scotland and United States of America.

The community of Boyne Tannum includes 537 Aboriginal and Torres Strait Islander people, which is 5.3 per cent of the population. There has been a gradual increase in the number of Aboriginal and Torres Strait Island people in Boyne Tannum, representing 3.5 per cent (347 people) of the population in 2016 and 2.6 per cent (251) of the population 2011, an increase of 286 people over 10 years.
English is the main language spoken at home for 91per centof the community in Boyne Tannum compared, to 87.1per centin the Gladstone Region.2.7per centof households in the Boyne Tannum community speak another language other than English at home.
The main religious followings in the Boyne Island and Tannum Sands community are:
- 47.9% - No religion
- 16.2% - Catholic
- 12.8% - Anglican
- 4.6% - Uniting Church
- 2.6% - Presbyterian and Reformed
- 2.3% - Christianity
- 1.5% - Pentecostal
- 1.2% - Baptist
- 0.8% - Lutheran
- 0.6% - Jehovah's Witnesses
- 0.6% - Buddhism
- 0.3% - Islam
In addition to 49.7 per cent of the community stating they had no religion, a further 6.7 per cent did not respond.
This equates to 4,822 community members either with no religion or unknown and 4,402 who reported religious affiliation.
There has been an increase of 22.9 per cent of community members stating they had no religion between 2011 and 2021. In addition, 25 per cent stated they had no religion in 2011 compared to 32 per cent of community members in 2016.
The main occupation categories for people aged 15 years and over in Boyne Tannum are:
- 21.5% - Technicians and Trade Operators
- 16.6% - Professionals
- 11.7% - Machinery Operators
- 11.6% - Community and personal service workers
- 10.8% - Clerical and Administrative Workers
- 10% - Labourers
- 8.7% - Managers
The most prominent occupation in the Boyne Island Tannum Sands area is Technicians and Trade Operators, with 21.5 per cent of residents employed in this category. This could be a result of the presence of Rio Tinto's Boyne Smelter in Boyne Island.
40 per cent of employed people in the Boyne Tannum community are employed by Boyne Smelters which is situated in Boyne Island.
Professionals and machinery operators are also prominently represented with 16.6 per cent and 11.7 per cent respectively.
Across the decade there have been several professions that have either significantly increased or decreased in the Boyne Island Tannum Sands area.
Of note, there has been an 87 per cent increase in residents working in Agriculture, Forestry and Fishing over the period of 2011 to 2021.
There has also been an 84 per cent increase in Artists and Recreation Services across the same period.
In the last five years, occupations such as Education and Training and Health Care and Social Assistance have also increased by 42 per cent in both categories.
There has been a significant decrease in Information Technology by 55 per cent, as well as 49 per cent decrease in Professional Scientific and Technical Services, which could be attributed to the end of a major construction period over the last five years.
Wholesale trade has also declined by almost fifty per cent, which may be a result of increased online shopping.
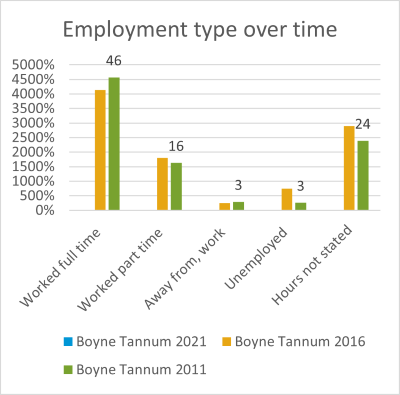
The number of people working full time has decreased by 8.5 per cent between 2011 and 2021, whilst there has been a consistent increase in part-time work by 20 per cent.
There has been a significant increase in residents working away, with a 35.3 per cent increase since 2016. There has also been an increase in residents not in the labour force, which could correlate with the increase in seniors ageing in place.
There was a staggering increase of 175 per cent of unemployed residents between 2011 and 2016, potentially a result of declining employment opportunities during the LNG construction period.This percentage has decreased in the subsequent census period by 44.7 per cent representing just 4 per cent of the suburb's population.
The top five industries of employment have been the same in 2011 and 2021 with some shifts in the ranking order, four of the five industries are also ranked in top five during 2021.
The top five industries in 2016 and 2021 were; manufacturing, construction, retail trade, health care and social assistance and education and training. In 2011 the top five ranked industries were manufacturing, construction, retail trade, health care and social assistance and Professional, Scientific and Technical Services.

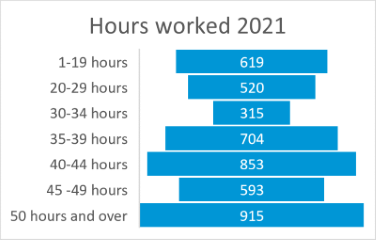
Hours worked can only be shown for 2021 and 2016 due this data not being captured in the 2011 Census.
There has been a three percent increase in the number of employees working 35 hours or more between 2016 and 2021, however, there has been a nine per cent reduction of employees working in excess of 45 hours a week. Subsequently, there has also been an increase of 12.5 per cent across the same period in part-time hours reflecting this type of employment as a popular trend in the Boyne Tannum community.

Over 90 per cent of workers travel to their place of work by car, either as driver or passenger, which has stayed consistent over the decade. Transport to work via bus increased by 431 per cent in 2011 representing the transport preference during the construction of the three LNG plants on Curtis Island.
Considerations:
- Over two third of the employed community work over 35 hours per week and therefore may need access to services either outside working hours or on weekends.
- 40 per cent of the population is employed by Boyne Smelters. Opportunities may exist to partner with industry to support the community.
| Industry |
2021 Pop |
% pop |
2016 Pop |
% pop |
2011 pop |
% pop |
% Change 2011- 2021 |
% Change 2016- 2021 |
% Change 2011- 2016 |
| Agriculture, Forestry and Fishing |
30 |
0.6% |
26 |
0.6% |
16 |
0.3% |
87.5% |
15.3% |
62.5% |
| Mining |
196 |
4.1% |
162 |
3.6% |
165 |
3.4% |
18.7% |
20.9% |
-1.8% |
| Manufacturing |
826 |
17.1% |
799 |
17.9% |
1,106 |
22.6% |
-25.3% |
3.3% |
-27.7% |
| Electricity, Gas, Water and Waste Services |
133 |
2.7% |
121 |
2.7% |
101 |
2.1% |
31.6% |
9.9% |
19.8% |
| Construction |
560 |
11.6% |
502 |
11.2% |
724 |
14.8% |
-22.6% |
11.5% |
-30.6% |
| Wholesale Trade |
52 |
1.1% |
58 |
1.3% |
101 |
2.1% |
-48.5% |
-10.3% |
-42.5% |
| Retail Trade |
350 |
7.2% |
402 |
9.0% |
430 |
8.8% |
-18.6% |
-12.9% |
-6.5% |
| Accommodation and Food Services |
333 |
6.9% |
277 |
6.2% |
242 |
4.9% |
37.6% |
20.2% |
14.4% |
| Transport, Postal and Warehousing |
312 |
6.5% |
298 |
6.7% |
240 |
4.9% |
30.0% |
4.6% |
24.1% |
| Information Media and Telecommunications |
8 |
0.2% |
23 |
0.5% |
18 |
0.4% |
-55.5% |
-62.2% |
27.7% |
| Financial and Insurance Services |
38 |
0.8% |
57 |
1.3% |
59 |
1.2% |
-35.5% |
-33.3% |
-3.3% |
| Rental, Hiring and Real Estate Services |
64 |
1.3% |
80 |
1.8% |
104 |
2.1% |
-38.4% |
-20.0% |
-23.0% |
| Professional, Scientific and Technical Services |
182 |
3.8% |
242 |
5.4% |
358 |
7.3% |
-49.1% |
-24.7% |
-32.4% |
| Administrative and Support Services |
144 |
3.0% |
129 |
2.9% |
119 |
2.4% |
21.0% |
11.6% |
8.4% |
| Public Administration and Safety |
223 |
4.6% |
182 |
4.1% |
173 |
3.5% |
28.9% |
22.5% |
5.2% |
| Education and Training |
474 |
9.8% |
423 |
9.5% |
332 |
6.8% |
42.7% |
12.0% |
27.4% |
| Health Care and Social Assistance |
498 |
10.3% |
383 |
8.6% |
350 |
7.2% |
42.2% |
30.0% |
9.4% |
| Arts and Recreation Services |
35 |
0.0% |
28 |
0.6% |
19 |
0.4% |
84.2% |
25.0% |
47.3% |
| Other Services |
140 |
0.6% |
142 |
3.2% |
134 |
2.7% |
4.4% |
-1.4% |
5.9% |
| Inadequately described/Not stated |
236 |
4.9% |
144 |
3.2% |
102 |
2.1% |
131.3% |
63.8% |
41.1% |
ABS Census Data, 2021, 2016, 2011
The Boyne Island Tannum Sands community has a higher socio-economic profile in comparison to the Gladstone Region.
- The median weekly household income is $1,948 compared to $1,693 for the Gladstone Region.
- 31 per cent of households earn $3,000 or more per week compared to 19.8 per cent for the Gladstone Region
- 6.4 per cent households earn less than $650 each week compared to 7.2 per cent for Gladstone Region, which is a decrease of 6.4 per cent compared to 2016.
- 39.6 per cent of non-family households earn less than $650 each week compared to 47.0 per cent for Gladstone Region, which is a 1.3 per cent increase compared to 2016.
61.8 per cent of people aged 15 and over are in the labour force, which is slightly higher than 2016 data at 59.6 pe rcent, but less than 2011 with 66.6 per cent.
The unemployment rate for the Boyne Tannum community has fluctuated over time being 3.8 per cent (296 people) in 2021, 7.6 per cent (536 people) in 2016 and 2.7 per cent (195 people) in 2011, which could be attributed to the volume of employment opportunities throughout construction periods and ongoing operations.
The Socio-Economic Indexes for Areas (SEIFA) is an index of relative socio-economic disadvantage, which in 2016 suggests the community of Boyne Island and Tannum Sands is less disadvantaged with a score of 1014.
The SEIFA score for Gladstone Region in 2016 was 978. Across Australia’s local government areas, SEIFA scores range from 188 (most disadvantaged) to 1186 (least disadvantaged).
27.3 per cent of households are owned outright in Boyne Island Tannum Sands which is slightly lower than the Gladstone Region at 29.1 per cent.
There has been a steady increase of households owned outright across the decade, with almost 25 per cent between the two Census periods.This is slightly higher than the regional percentage of 21 per cent across the same period.The continued increase may correlate with a similar trend of increase in over 65 residents wishing to age in place.
Almost 40 per cent of households have a mortgage in Boyne Tannum, compared to 36 per cent for the Gladstone Region and
39.6 per cent of households have a mortgage in Boyne Tannum, compared to 36.5 per cent for Gladstone Region and 34.4 per cent for the State. There has been very little change in the percentage of mortgagees in the Boyne Island Tannum Sands area across the decade.
31.7 per cent of dwellings are rented in Boyne Island Tannum Sands compared to 33.3 per cent in the Gladstone Region. Whilst slightly lower than the region, there has been a 28 per cent increase in renters in the Boyne Tannum area.
There has been a 30.7 per cent increase in residents that have rented from a State Housing Authority between 2011 and 2021.In addition, there has been a 142 per cent increase in residents renting from Community Housing Providers.
The average mortgage repayment is $1,733 which is higher than the Gladstone Region by $133 but the same as the State. There has been a $434 reduction in average mortgage payments between 2021 and 2011 with the largest reduction being $325 between 2021 and 2016.
There is a general trend of monthly mortgage payments between $2,400 and $4,000 reducing over the last 10 years. Households paying $2,400-$2,999 reduced by 7.1 per cent (100), those paying $3,000- $3,999 reduced by 9.7 per cent (135).
There is a general increase of households paying between $0 -$2,399 over the same period. The most significant change is an 8.9 per cent increase (123) for those paying $1,400-$,1799 and those paying $1,000-$1,399 with a 7.4 per cent (100) increase.
The median rent for Boyne Tannum is $300 compared to $275 in the Gladstone Region and $365 in the State. The median rent in Boyne Tannum has fluctuated over time being, $300 in 2021, $200 in 2016 and $360 in 2011.The construction of the LNG industries on Curtis Island may have impacted on the high rental price in 2011.
Considerations:
Across the decade there has been an increase in home owners without a mortgage. This increase correlates with the increase in over 65 residents staying in the region until 85. Health services and programs supporting wellbeing should be considered for this area.
A large proportion of people living in Boyne Island Tannum Sands are relatively affluent and should have the financial capacity to pursue activities and use facilities and services. However, affordable activities should still be provided to support lower income households, older adults and students who are likely to earn lower incomes.
With the significant increase of retiree's ageing in place at Boyne Island and Tannum Sands, infrastructure planning could consider this locality for retirement living. With the nation's housing crisis affecting all areas, this strategy could free up housing stock for other purposes.
Department of Social Services Payments
Education, Employment & Young People:
| Year - Quarter |
ABSTUDY (Non-living allowance) |
Austudy |
Job Seeker Payment |
Newstart Allowance |
Youth Allowance (other) |
Youth Allowance (Student and apprentice) |
| 2019 Jan-Mar |
13 |
10 |
- |
369 |
65 |
20 |
| 2019 Apr-Jun |
10 |
7 |
- |
337 |
67 |
22 |
| 2019 Jul-Sept |
7 |
7 |
- |
326 |
47 |
24 |
| 2019 Oct-Dec |
7 |
7 |
- |
333 |
53 |
22 |
| 2020 Jan-Mar |
9 |
7 |
360 |
- |
64 |
20 |
| 2020 Apr-Jun |
9 |
6 |
585 |
- |
83 |
21 |
| 2020 Jul-Sept |
9 |
5 |
552 |
- |
65 |
24 |
| 2020 Oct-Dec |
10 |
- |
544 |
- |
61 |
20 |
| 2021 Jan-Mar |
5 |
- |
477 |
- |
57 |
21 |
| 2021 Apr-Jun |
6 |
7 |
416 |
- |
37 |
22 |
| 2021 Oct-Dec |
8 |
- |
377 |
- |
35 |
13 |
Seniors
| Year - Quarter |
Age Pension |
C'wealth Seniors Health Card |
Pensioner Concession Card |
| 2019 Jan-Mar |
739 |
121 |
1462 |
| 2019 Apr-Jun |
745 |
120 |
1484 |
| 2019 Jul-Sept |
736 |
118 |
1474 |
| 2019 Oct-Dec |
742 |
117 |
1472 |
| 2020 Jan-Mar |
751 |
122 |
1466 |
| 2020 Apr-Jun |
755 |
129 |
1501 |
| 2020 Jul-Sept |
769 |
135 |
1517 |
| 2020 Oct-Dec |
783 |
133 |
1530 |
| 2021 Jan-Mar |
804 |
139 |
1519 |
| 2021 Apr-Jun |
808 |
147 |
1546 |
| 2021 Oct-Dec |
806 |
146 |
1545 |

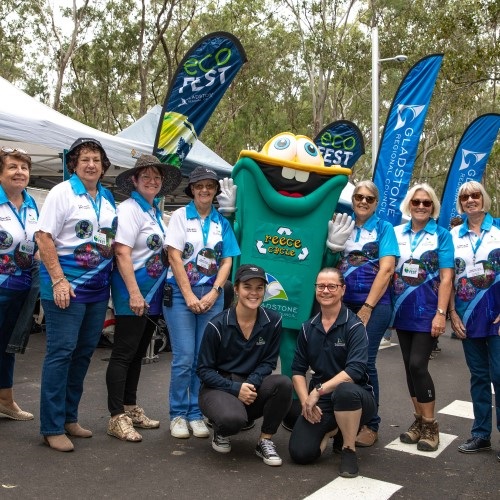
Photo courtesy of Rio Tinto

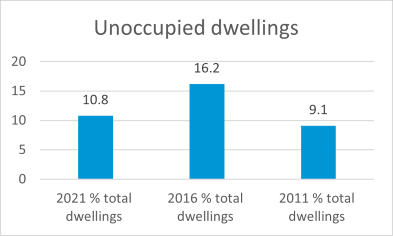
81.8 per cent dwellings are occupied in Boyne Island Tannum Sands, compared with 85 per cent in the Gladstone Region.
Since 2011 there has been a decrease of 10 per cent in the number of occupied dwellings.
Considerations:
Where there is medium and higher density housing there can be greater demand for open space, indoor recreation facilities, public places, entertainment opportunities and green infrastructure including appealing streetscapes.
| Occupancy |
|
2021 % total dwellings |
2016 % total dwellings |
2011 % total dwellings |
| Total occupied dwellings |
81.8 |
83.9 |
90.9 |
| Unoccupied private dwellings |
10.8 |
16.2 |
9.1 |

4.6 per cent of the community requires assistance with core activities. This represents 465 people.
The number of people requiring assistance has increased by 205 people in the ten-year duration between the 2011 and 2021 Census, representing an increase of 78.8 per cent. The need for assistance has seen a steady rise over the decade, with a sizeable increase of almost 50 per cent across the five-year period between 2016 and 2021.
In addition, the number of people that have 'not stated' a need for assistance has decreased by 14.9 per cent between 2011 and 2021.
Whilst there is a large representation of over 55 years that require assistance with core activities, there is also an identified need in young people, particularly in the 5-14 year age group.
The 5-14 year age group has seen a 38.5 per cent increase over the past five years, or an additional 22 young people in the period. A significant increase was also reported for those aged 55-85, with 187 more people requiring support with core activities than in 2011.

There are 850 people providing unpaid assistance to a person with a disability, health condition or due to old age, which is an increase of 297 people from 2011. There are 25 (2.9 per cent) young people aged 15-19 providing unpaid support, 215 (25 per cent) people aged 45-54, and 55-64 with 187 people or 22 per cent. Those aged 35-44 make up 17.5 per cent of those that provide support which equates to 149 people.
The biggest increases between 2011 and 2021 were seen with those aged 45-54 years, with 94 more people providing unpaid support, followed by those aged 65-74, with 66 more people providing unpaid support.
Mental health conditions (including depression or anxiety) are the highest long-term health condition in the Boyne Island Tannum Sands region, with 833 people, or almost 10 per cent of the population. People identifying with this health condition are most likely to be in the 25-65 year age group, representing almost 70 per cent of the total. Young people are also reporting this long-term health condition with 17.2 per cent in the 0-25 year age group. Mental health is slightly higher from a regional perspective at 9.5 per cent.
Arthritis is most prevalent in the over 55 community and is consistent in both Boyne Tannum and across the Gladstone Region.
Asthma is experienced across the age profile, with 6.4 per cent of the Boyne Tannum community experiencing this long-term health issue. Rates are slightly higher across the region at 7.9 per cent.
Considerations:
- Mental health continues to be the most prevalent long-term health condition across the region, and in Boyne Island Tannum Sands. 17.2 per cent of people with mental health conditions are aged between 0-25 years, and almost 70 per cent are aged between 25-65. Community Development programs should consider targeted programs for young people and the middle aged.
- Almost 25 per cent of people requiring assistance with core activities are aged between 5-14 years. Consideration should be given when planning for parks and recreation, cycle paths, and youth programs.
|
2021 |
% |
2016 |
% |
2011 |
% |
% Change 2021- 2011 |
% Change 2021- 2016 |
% Change 2016- 2011 |
| Has need for assistance 2021 |
465 |
4.6 |
311 |
3.1 |
260 |
2.7 |
78.8% |
49.5% |
19.6% |
| Does not have need for assistance 2021 |
9049 |
89.9 |
8966 |
90.6 |
8753 |
90.6 |
3.3% |
0.9% |
2.4% |
| Need for assistance not stated 2021 |
547 |
5.4 |
627 |
6.3 |
643 |
6.7 |
-14.9% |
-12.7% |
-2.4% |
| Age Group |
Has need for assistance |
Does not have need for assistance |
Need for assistance not stated |
Total |
| 0-4 years |
10 |
573 |
20 |
597 |
| 5-14 years |
79 |
1392 |
74 |
1544 |
| 15-19 years |
31 |
601 |
32 |
664 |
| 20-24 years |
0 |
387 |
18 |
400 |
| 25-34 years |
17 |
999 |
62 |
1074 |
| 35-44 years |
31 |
1159 |
62 |
1249 |
| 45-54 years |
36 |
1362 |
93 |
1489 |
| 55-64 years |
80 |
1228 |
73 |
1390 |
| 65-74 years |
81 |
722 |
67 |
868 |
| 75-84 years |
59 |
254 |
30 |
344 |
| 85 years and over |
33 |
35 |
21 |
88 |
| Totals |
456 |
8715 |
534 |
9715 |
Census 2021
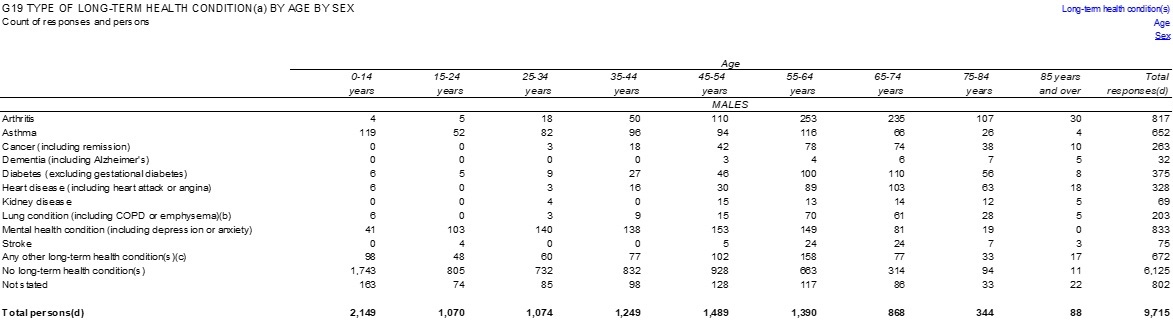
TOP 5 Long-Term Health Conditions
| Condition |
Boyne Island Tannum Sands
% of population |
Gladstone Region
% of population |
| Mental Health (including anxiety and depression) |
8.5% (833) |
9.5% (6074) |
| Arthritis |
8.4% (817) |
8.4% (5392) |
| Any other long-term health condition |
6.9% (672) |
7.6% (4834) |
| Asthma |
6.7% (652) |
7.9% (5079) |
| Diabetes (excluding gestational diabetes) |
3.8% (375) |
4.6% (2953) |
Volunteering is strong in the Boyne Tannum community with 1433 (18.3 per cent) people aged 15 years and over providing volunteer services. This compares to 16.2 per cent for the Gladstone Region.
While volunteerism in Boyne Tannum is strong, the number of volunteers has fluctuated. In 2011 there were 1,524 volunteers, which increased by 258 in 2016. This decreased by 349 in 2021. Overall, there has been a net decrease on volunteering of 91 volunteers.
There have been reductions in volunteer numbers for those aged 20-55 between 2011 and 2021. The largest decrease as been for those aged 35-44 at 8.9 per cent or 15 people. The largest decrease took place between 2021 and 2016 at 6.3 per cent.
There were increases in volunteering rates for those aged 15-19 and those aged between 55 and 84. The largest of these increases was for people aged 65-74 at 7.9 per cent, representing 110 people.
With a population of just shy of 10,000, the Boyne Island Tannum Sands community has a large number of community groups supported by a strong volunteer base.
There are currently 10 active community groups in the area, eight community sporting groups and three large community-led destination events, the Boyne Tannum Hookup, Under the Trees and the monthly Beach Arts Music (BAM) Markets.
Tannum Sands Beach is patrolled by Surf Life Saving Queensland and has an active volunteer base supporting its weekend and school holiday roster.
Considerations:
- With a high number of working families in the area, time to volunteer may be limited.
- There is opportunity to strengthen the number of volunteers.
- There is a strong presence of seniors residing in Boyne Tannum that could be welcomed into volunteer programs.
Council regularly undertakes a Community Satisfaction Survey to identify community sentiment with respect to its assets, services and programs.
|
Boyne Island |
Tannum Sands |
Gladstone Region |
LGA Benchmark |
| Overall satisfaction |
50.3% |
58.3% |
55.0% |
55.7% |
|
|
|
|
|
| ASSETS |
|
|
|
|
| (1 = very dissatisfied – 100= very satisfied) |
|
|
|
|
| Landfills and waste management facilities |
73.3% |
76.7% |
72.9% |
70.2% |
| Art Galleries and museums |
68.2% |
74.0% |
72.7% |
70.7% |
| Public toilets and amenities |
65.7% |
78.6% |
69.1% |
67.7% |
| Libraries |
76.5% |
82.9% |
79.7% |
78.0% |
| Airports and aerodromes |
71.2% |
71.8% |
70.8% |
70.1% |
| Parking facilities and street parking |
67.7% |
72.2% |
66.0% |
65.7% |
| Performing arts centres |
68.0% |
71.9% |
69.1% |
69.0% |
| Lighting and signage |
67.8% |
72.2% |
68.3% |
68.9% |
| Beaches and coastal areas |
72.3% |
75.8% |
73.1% |
73.7% |
| Landscapes and streetscapes |
72.0% |
72.3% |
69.5% |
70.1% |
| Halls and community centres |
75.2% |
72.4% |
70.7% |
72.2% |
| Stormwater and flood control system |
70.9% |
70.0% |
65.8% |
67.1% |
| Water and sewerage system |
70.5% |
74.4% |
69.4% |
71.5% |
| Boat ramps and jetties |
73.0% |
75.8% |
68.8% |
71.0% |
| Parks and open space |
75.0% |
79.0% |
72.3% |
75.0% |
| Footpaths and cycleways |
74.8% |
70.5% |
65.4% |
68.1% |
| Local roads and bridges |
65.5% |
67.3% |
63.0% |
65.8% |
| Sport and recreation facilities |
70.8% |
70.2% |
69.1% |
73.2% |
| Camping grounds and caravan parks |
69.2% |
70.0% |
64.6% |
68.9% |
| Swimming pools and aquatic centres |
53.8% |
62.1% |
62.0% |
71.5% |
|
|
|
|
|
| SERVICES |
|
|
|
|
| (1 = very dissatisfied – 100= very satisfied) |
|
|
|
|
| Waste services |
77.9% |
78.0% |
74.5% |
74.0% |
| Customer service |
70.8% |
75.1% |
69.3% |
69.7% |
| Consulting with the community |
59.1% |
60.0% |
59.7% |
61.1% |
| Building services |
67.6% |
65.3% |
62.8% |
64.8% |
| Animal management services |
70.0% |
62.4% |
63.6% |
66.1% |
| Informing the community of council decisions |
58.4% |
60.5% |
61.7% |
64.4% |
| Financial management |
56.7% |
59.5% |
58.2% |
61.1% |
| Environmental management |
71.5% |
65.5% |
62.8% |
66.4% |
| Making and enforcing local laws |
71.0% |
58.5% |
60.9% |
64.9% |
| Advocating on behalf of the community |
52.8% |
61.0% |
59.9% |
64.2% |
| Making decisions in the best interest of the community |
58.3% |
55.4% |
57.3% |
61.5% |
| Community services |
53.6% |
64.8% |
64.4% |
69.8% |
| Planning and development approval |
57.4% |
62.0% |
57.6% |
62.5% |
| Infrastructure and property services |
70,8% |
63.4% |
59.5% |
64.8% |
| Public health services |
56.9% |
62.8% |
63.8% |
71.0% |
| Biosecurity and environmental health |
63.2% |
61.1% |
60.1% |
66.8% |
|
|
|
|
|
| INITIATIVES |
|
|
|
|
| (1: Far too little – 100: Far too much) |
|
|
|
|
| Affordable housing development |
55.0% |
62.9% |
52.5% |
49.7% |
| Community safety and crime prevention |
43.2% |
45.3% |
47.9% |
47.5% |
| Creative arts development |
65.0% |
65.0% |
59.3% |
59.2% |
| Celebration of multiculturalism |
63.8% |
65.0% |
60.9% |
61.5% |
| Festivals and events |
61.7% |
59.5% |
55.9% |
56.8% |
| Celebration of First Nation culture |
64.2% |
65.2% |
62.4% |
63.3% |
| Business development and support |
55.2% |
61.2% |
54.5% |
55.4% |
| Heritage conservation |
58.9% |
58.0% |
53.7% |
55.1% |
| Tourism development and promotion |
54.8% |
57.8% |
56.1% |
57.3% |
| Placemaking to create lively public spaces |
57.6% |
58.9% |
54.3% |
55.9% |
| Opportunities for people of all abilities to participate in community life |
58.8% |
53.3% |
52.3% |
53.9% |
| Grants and support for sports clubs and community organisations |
61.1% |
62.4% |
56.0% |
57.9% |
| Environmental conservation and climate change action |
59.1% |
62.4% |
55.0% |
56.8% |
| Waste minimisation and recycling |
50.0% |
54.7% |
52.2% |
54.4% |
| Children and youth development |
43.8% |
53.3% |
50.6% |
53.6% |
| Childcare |
47.4% |
54.7% |
54.1% |
57.6% |
| Skill development and networking opportunity |
51,1% |
51.9% |
50.9% |
54.5% |
| Health promotion |
47.6% |
52.7% |
52.3% |
55.8% |
| Newcomer attraction and retention |
47.8% |
50.0% |
51.8% |
55.6% |
| Aged care and accommodation |
38.0% |
46.2% |
41.3% |
50.3% |
Boyne Tannum Aquatic Recreation Centre
Within the Boyne Tannum community there is significant support for the development of an Aquatic Centre which was evident from Councils most recent community perception survey.
On 15 March 2022, Council, at its General Meeting adopted the Concept Design proposed for the Boyne Tannum Aquatic Recreation Centre (BTARC).
The Concept Design focuses on providing a facility that can meet both current and future aquatic recreation needs of the Boyne/Tannum community. The aquatic centre will be located on Council’s preferred site at Lot 900, Coronation Drive, Tannum Sands.
The Concept Design includes:
- FINA standard, eight lane 50 metre outdoor heated pool with bulkhead.
- Distinct recreational zone with a twin waterslide attraction.
- Kiosk and general amenities, green space with shaded turf seating areas and spectator embankment.
- All abilities access (pool ramp) and pool shading for sun safety and comfort.
- Carparking and landscaping.
The next stage of the project development is to complete the design phase (detailed design) and obtain the relevant statutory approvals. On completion of this work, Council will proceed to consider its final investment decision on the project.
The Labor Commonwealth Government has made an election funding commitment of $15 million towards the development of this project.
Council's online platform Conversations is regularly updated with information about the project.
Customer Service Requests
The Boyne Tannum community engaged with Council on the following customer service requests from 1 December 2020 to 1 December 2021. During this period, 1,956 customer service requests were received.
| Customer Service Request Type |
Amount |
| Request to change address / details |
235 |
| Leak on footpath or road |
210 |
| Repair / replacement of wheelie bin |
209 |
| Development services enquiries |
204 |
| Water meter enquiry / issue / reading |
133 |
| Animal noise nuisance |
103 |
| Operating plant alarms |
83 |
| Tree maintenance requests & land enquiries |
81 |
| Waste collection issues - missed collection |
78 |
| Defects to sewer infrastructure |
77 |
| Overgrown private property complaint |
69 |
| Animal registration or compliance |
56 |
| Drainage |
52 |
| Roaming dog or cat |
50 |
| Animal registration replacement tag |
48 |
| Collection of found roaming animal |
46 |
| Road signage |
47 |
| Building and plumbing compliance |
46 |
| Public waste services |
45 |
Rating Arrears
The Boyne Tannum community's socio-economic position is slightly higher than that of the broader Gladstone Region.The median weekly household income for Boyne Tannum is $1,948 compared to $1,693 for the Gladstone Region.
Residential rate arrears are in the higher end of the scale, with 294 properties in arrears as at 30 October 2021, 0.8 per cent higher than 30 June 2022. The total rateable properties in Boyne Island and Tannum Sands is 4,339. On average, 6.8 per cent of households have outstanding rate payments.
On 30 June 2022, 2.7 per cent of rateable commercial properties were in arrears, meaning 11 ratepayers were in arrears. This increased to 22 rate payers as of 31 October 2022.
Education
Boyne Island Primary School
Prep-Year 6
412 enrolments (August. 2021)
Tannum Sands State School
Prep-Year 6
600 enrolments (August. 2021)
Tannum Sands State High School
Year 7-Year 12
893 students (August. 2021)
St Francis Catholic School
Prep-Year 6
212 students (August. 2021)
Clearview Christian College
Year 7-Year 12
Opening in 2023 with Year 7 and Year 8
Boyne Island Environmental Education Centre
Prep-Year 12
Day trips provided aligned with cirriculum
Community Facilities
Boyne Tannum Community Centre
Cnr Wyndham & Hayes Avenue, Boyne Island
Provides customer services for Gladstone Regional Council. The Centre has five rooms available for hire:-
- Heron Room
- Mount Larcom Room
- Kroombit Room
- Port Curtis Room
- Castletower Building
Boyne Island Library
Cnr Wyndham & Hayes Avenue, Boyne Island
Provides public access computers, programs for adults and children, lending of books, DVDs, CDs, online resources.
Tannum Sands RSL Hall
Cnr Pacific Ave & Ocean Street
Community hall with dance floor, stage, basic kitchen, all access.
Ocean Breeze Gallery
27 Ocean Street
Community gallery operated by volunteers featuring art and craft from locals across the Gladstone Region. Workshops and social gatherings held to bring community together.
Child Care
C&K Community Kindergarten Tannum Sands
Kindergarten program
three to five years - 24 approved places
Goodstart Early Learning Tannum Sands
(6am-6pm)
Long day care, Kindergarten and Vacation Care
Six weeks to 12 years - 74 approved places
Milestones Early Learning Boyne Island
(6am - 6pm)
Long daycare and Kindergarten
Six weeks to five years - 80 approved places
Milestones Early Learning Riverstone Rise
(6am-6pm)
Long daycare and Kindergarten
Six weeks to five years -107 approved places
Tannum Sands Kindergarten
(8.30am-2.30pm)
Three years to five years - 25 approved places
St Francis Outside Hours Care Tannum Sands
(6am-6pm)
Before and after school care
Five years to 12 years - 60 approved places
Helping Hands Boyne Island
(6am-6pm)
Before and after school care
Five years to 12 years - 46 approved places
Helping Hands Tannum Sands
(6am-6pm)
Before and after school care and vacation care
Five years to 12 years - 75 approved places
Community Groups
- Boyne Tannum Scout Group
- Boyne Tannum Hook Up Association
- Boyne Tannum SES
- Boyne Tannum Men’s Shed
- MyCity Church
- QCWA – Tannum Sands
- Lions Club Boyne Island
- Boyne Tannum RSL Sub Branch
- Boyne Tannum Arts Business & Community Inc
- Turtleway Artscape
- Rotary Club of Boyne Tannum
- Boyne Smelter - Here for Gladstone
Sporting Groups
- Tannum Sands Surf Life Saving Club
- Tannum Boyne Seagulls Rugby League Football Club Inc
- BITS Golf Club
- BITS Saints AFL Club
- Boyne Tannum Bullets Swim Club
- Boyne Tannum Sharks Football Club
- Curtis Coast Dolphins Netball Assoc Boyne Island
- BITS Cricket Club
Community Led Events
- Beach Arts Music (BAM) Markets
- Under the Trees Music Festival
- Boyne Tannum Hookup
Parks
Boyne Island:
- Bray Park, Wyndham Road
- Corimba Park, Riverstone Rise Boulavard
- Stirling Park, Malpas Street
- Wyndham Park, Alkina Crescent
Tannum Sands:
- Canoe Point Wetlands, Canoe Point Road
- Gullarn Ngheere Park, Bamba Street
- Millennium Esplanade, Millennium Esplanade
- Peters Play Park, Ocean Street
Sport and Recreation
- Dennis Park Sporting Precinct
- Turtle Way Cycle Path
- Riverside Skateway
- Tanyella Recreation Grounds
- Tannum Sands Beach