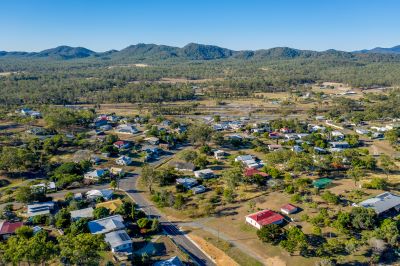
Only a short drive south from Gladstone is the small picturesque rural township of Mount Larcom. The township is best known for its annual agricultural show which has been running for 103 years. Mount Larcom has the Gladstone Region’s most prominent natural landmark, Mt Larcom, a challenging trek to the peak rewards 360-degree views of the region. Gladstone harbour can easily be seen from the summit and on a clear day, reef islands can be seen to the east and Rockhampton to the north. With a population of close to 300, this small regional community has a great sense of pride and community.
Compared to the Gladstone Region and Queensland, the township of Mount Larcom has:
- Median age of 42 is slightly higher than the state.
- Lower cultural diversity than Gladstone and significantly lower than the State.
- Lower proportion of couples with children than the region and the State.
- Households have a significantly lower income than the region and State with negligible change over the last 5 years.
- Higher number of households owned with a mortgage than the region and State. This has increased over the past 5 years.
- Slightly higher proportion of people attending university than the region but significantly lower than the State.
| Data focus |
Mount Larcom |
|
Gladstone Region |
Queensland |
|
2021 |
2016 |
Change 2021- 2016 |
2021 |
2021 |
| Median age |
42 |
41 |
1 |
38 |
38 |
| Non English-Speaking Backgrounds |
0 |
0 |
0 |
5% |
12.6% |
| Couple Family with children |
38.9% |
49.40% |
-21.2% |
41.7% |
55.4% |
| Couple Family without children |
41.0% |
36.50% |
12.3% |
40.5% |
28.0% |
| Average number of people per household |
2.3 |
2.4 |
-4.1% |
2.5 |
2.5 |
| Household with a mortgage |
42% |
35.60% |
17.9% |
37.0% |
34.4% |
| Households renting |
14.3% |
17.8% |
-19.6% |
33.4% |
33.0% |
| Median weekly household income |
$1,268 |
$1,292 |
-$24 |
$1,639 |
$1,675 |
| Median monthly mortgage repayments |
$1,300 |
$1,542 |
-$242 |
$1,600 |
$1,733 |
| Median weekly rent (overall) |
$190 |
$225 |
-$35 |
$275 |
$365 |
| University attendance |
0% |
6.50% |
-100% |
7.2% |
14.2% |
In 2021 the communities of Mount Larcom had a population of 319, which is a decrease of 46 people since 2016.
In 2021, the median age for Mount Larcom was 42 which is slightly higher than the Gladstone Region at 38 and the Queensland median age of 38.
Since 2016 the median age of the Mount Larcom community has increased from 41 to 42 years of age.
The Mount Larcom community is diverse across age groups with people living in the area until their senior years.
Across the decade there have been changes in all age categories, with the most notable growth in the 80-84 year category, which whilst only four people, represents a 133 per cent increase.
The largest decline in population was the 40-44 age group, with a 55.2 per cent decrease or 16 people.
Other noticeable changes were as follows:
- 35-39 years - increase of 52.6 per cent
- 50-54 years - decrease of 48.1 per cent
- 70-74 years - increase of 91.7 per cent
When compared to the Gladstone Region and State there are some noticeable differences, with Mount Larcom having a higher percentage of the population aged 55-74 compared to the region and State and a lower percentage of their population aged 75-79, 40-54, 15-34 and 0-4 years old.
In 2021, the age groups that differ most to the Gladstone Region are:
- There has been a decrease of babies and pre-schoolers by 37.5 per cent or nine people between 2016 and 2021, moving the percentage of young people in this age bracket 30 per cent less than the region.
- There is a decrease in older workers, empty nesters and retirees as a percentage of the population between 2016 and 2021, with a decrease of 47 people.
- Over the same period there was an increase of seniors aged 70-84 that make up the population in 2021, with a 66 per cent change or 14 people compared to 2016.
When planning services, consideration should be given to the level of service required for Mount Larcom’s declining population.
A particular focus needs to be on access to services and programs for seniors in the community, which has potential to lead to a higher proportion elderly community member aged 85 than the region over the next five years.
Consideration also needs to be given to the types of sport and recreation opportunities needed for the Mount Larcom community given the reduction in younger people living in the community.

source ABS 2022, 2016
| Age |
Mount Larcom |
Gladstone Region |
Queensland |
|
2021 Pop |
% pop |
2016 Pop |
% pop |
% Change 2021 - 2016 |
2021 Pop |
% pop |
2021 Pop |
% pop |
| Median age |
42 |
N/A |
41 |
N/A |
N/A |
38 |
N/A |
38 |
N/A |
| 0-4 years |
15 |
4.7 |
24 |
6.5 |
-37.5% |
4,049 |
6.4 |
292,452 |
5.7 |
| 5-9 years |
22 |
6.9 |
19 |
5.2 |
15.8% |
4,686 |
7.4 |
329,311 |
6.4 |
| 10-14 years |
27 |
8.46 |
34 |
9.2 |
-20.6% |
4,913 |
7.7 |
342,560 |
6.6 |
| 15-19 years |
19 |
5.96 |
21 |
5.7 |
-9.5% |
4,001 |
6.3 |
313,506 |
6.1 |
| 20-24 years |
15 |
4.7 |
19 |
5.2 |
-21.1% |
3,159 |
5 |
323,739 |
6.3 |
| 25-29 years |
13 |
4.1 |
11 |
3 |
18.2% |
3,766 |
5.9 |
347,687 |
6.7 |
| 30-34 years |
16 |
5 |
23 |
6.3 |
-30.4% |
4,066 |
6.4 |
354,033 |
6.9 |
| 35-39 years |
29 |
9.1 |
19 |
5.2 |
52.6% |
4,280 |
6.7 |
357,120 |
6.9 |
| 40-44 years |
13 |
4.1 |
29 |
7.9 |
-55.2% |
4,069 |
6.4 |
330,692 |
6.4 |
| 45-49 years |
19 |
6 |
18 |
4.9 |
5.6% |
4,518 |
7.1 |
340,287 |
6.6 |
| 50-54 years |
14 |
4.4 |
27 |
7.3 |
-48.1% |
4,546 |
7.2 |
333,843 |
6.5 |
| 55-59 years |
27 |
8.5 |
31 |
8.4 |
-12.9% |
4,524 |
7.1 |
316,378 |
6.1 |
| 60-64 years |
26 |
8.2 |
34 |
9.2 |
-23.5% |
4,154 |
6.5 |
298,919 |
5.8 |
| 65-69 years |
26 |
8.2 |
31 |
8.4 |
-16.1% |
3,190 |
5 |
264,515 |
5.1 |
| 70-74 years |
23 |
7.2 |
12 |
3.3 |
91.7% |
2,532 |
4 |
238,952 |
4.6 |
| 75-79 years |
5 |
1.6 |
6 |
1.6 |
-16.7% |
1,507 |
2.4 |
168,385 |
3.3 |
| 80-84 years |
7 |
2.2 |
3 |
0.8 |
133.3% |
886 |
1.4 |
106,611 |
2.1 |
| 85 years and over |
3 |
0.9 |
7 |
1.9 |
-57.1% |
679 |
1.1 |
97,140 |
1.9 |
| Group |
Age |
Mount Larcom |
Gladstone Region |
|
|
2021 |
% pop |
2016 |
% pop |
% Change 2016-2021 |
2021 |
% pop |
| Babies and pre-schoolers |
0-4 yrs |
15 |
4.7 |
24 |
6.5 |
-37.5% |
4,049 |
6.4% |
| Primary and secondary schoolers |
5-19 yrs |
68 |
21.3 |
74 |
20.1 |
-8.1% |
13,600 |
28.8% |
| Tertiary education and independence |
20-24 yrs |
15 |
4.7 |
19 |
5.2 |
-21.1% |
3,159 |
5.0% |
| Young workforce |
25-29 yrs |
13 |
4.1 |
11 |
3 |
18.2% |
3,766 |
5.9% |
| Parents and home builders |
30-49yrs |
77 |
24.1 |
89 |
24.2 |
-13.5% |
16,933 |
26.6% |
| Older workers and retirees |
50-59 yrs |
41 |
12.9 |
58 |
15.8 |
-29.3% |
9,070 |
14.3% |
| Empty nesters and retirees |
60-69 yrs |
52 |
16.3 |
65 |
17.7 |
-20.0% |
7,344 |
13.6% |
| Seniors |
70-84 yrs |
35 |
11 |
21 |
5.7 |
66.7% |
4,925 |
7.8% |
| Elderly aged |
85+ |
3 |
0.9 |
7 |
1.9 |
-57.1% |
679 |
1.1% |
Service group breakdown compared to the Region, source ABS 2022, 2016
The Mount Larcom Community has diverse household types with the main groups being couples with children and couples without children.
There is a slightly higher percentage of couple families without children in Mount Larcom at 41.0per cent of the population, in comparison to 40.5per cent in the Gladstone Region and 40.3per cent for the state. In 2016, couple families without children made up 36.5per cent of families compared to 41.0per cent in 2021, while this looks to be a sizeable decrease it represents two families.
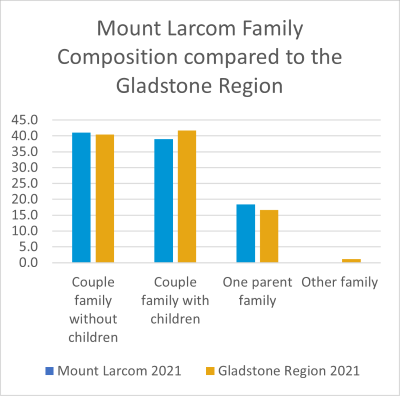
Between 2016 and 2021, there was a sizable decrease of 28.5 per cent or 37 people in the number of couple families with children, decreasing to 38.9 per cent of the population in 2021. This is 6.7 per cent lower than the region and 5.5 per cent lower than the State.
One parent families represented 18.4 per cent of the community, in 2021, an increase of 33 per cent (10 families) since 2016. This is higher than the region by 10.8 per cent and 102 per cent higher than the State.
People in a registered marriage make up 48.9 per cent (113 people) of Mount Larcom in 2021, which is higher than the Gladstone Region at 43.6 per cent.
Between 2016 and 2021, the percentage of population in a registered marriage decreased by 0.9 per cent, and similarly people in a de facto marriage decreased by 20.5 per cent and those not married decreased by 8.3 per cent.
Considerations:
- Approximately 2/3 of the community are families with children, with most of the children in the school aged category. Consideration of suitable programming for this demographic should be considered as well as the timing for delivery of these programs.
- Children in the Mount Larcom area are mostly school aged. Programming and infrastructure selection should focus on the age demographics 5-14, with 49 children falling into this bracket.
| Mount Larcom |
Gladstone Region |
Queensland |
|
2021 |
% pop |
2016 |
% pop |
% Change 2016 - 2021 |
2021 pop |
% pop |
2021 pop |
% pop |
| Couple family without children |
98 |
41 |
96 |
36.5 |
2.1% |
6,829 |
40.5% |
551,069 |
40.3% |
| Couple family with children |
93 |
38.9 |
130 |
49.4 |
-28.5% |
7,021 |
41.7% |
563,327 |
41.2% |
| One parent family |
44 |
18.4 |
33 |
12.5 |
33.3% |
2,798 |
16.6% |
124,174 |
9.1% |
| Other family |
0 |
0.8 |
23 |
0.9 |
-100.0% |
202 |
1.2% |
46707 |
3.4% |
Social Marital Status
| Mount Larcom |
Gladstone Region |
|
2021 |
% pop |
2016 |
% pop |
% Change 2016 - 2021 |
2021 |
% pop |
| Registered marriage |
113 |
48.9 |
114 |
44.7 |
-0.9% |
20,253 |
43.6% |
| De facto marriage |
31 |
13.4 |
39 |
15.3 |
-20.5% |
6,476 |
14.8% |
| Not married |
88 |
38.1 |
96 |
37.6 |
-8.3% |
16,998 |
38.8% |

In 2021, 80.7 per cent of the Mount Larcom population was born in Australia compared to 79.6 per cent in the Gladstone Region.
A further 4 per cent were born overseas from, England, Sri Lanka and Thailand. 12 per cent did not state their country of birth.
The community of Mount Larcom includes 17 Aboriginal and Torres Strait Islander people, which is 5 per cent of the population. There has been a minimal increase in the number of Aboriginal and Torres Strait Island people in Mount Larcom between 2016 and 2021, with an increase of one person.
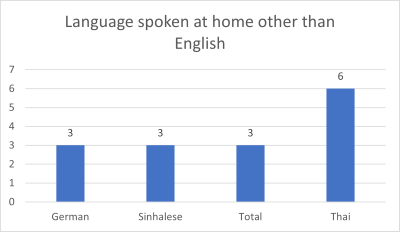 English is the main language spoken at home for 84 per cent of the community in Mount Larcom, compared to 87.1 per cent in the Gladstone Region. In 2021, 4.5 per cent of households in the Mount Larcom community speak another language other than English at home.
The main religious followings in the Mount Larcom community are:
- 45.9% - No religion
- 14.8% - Anglican
- 14.2% - Catholic
- 4.5% - Uniting Church
- 3.0% - Presbyterian and Reformed
- 2.7% - Buddhism
- 1.8% - Baptist
In addition to 49.7 per cent of the community stating they had no religion, a further 11 per cent did not respond.This equates to 185 community members either with no religion or unknown and compared to 143 people who reported religious affiliation.
There has been an increase of 70 per cent of community members stating they had no religion between 2016 and 2021, with 27 per cent stating they had no religion in 2016.
The main occupation categories for people aged 15 years and over in Mount Larcom are:
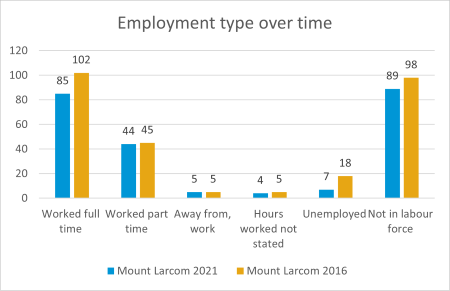
23.0% - Community and personal service workers
21.6% - Technicians and trades workers
18.9% - Machinery Operators
8.1% - Professionals
6.8% - Managers
4.1% - Clerical and Administrative workers
Most occupational categories have seen some change, in 2021 Community and personal service made up 23 per cent (17 people) of the workforce compared to 12.6 per cent (11 people) of the workforce in 2016, a 54.5 per cent increase.
The number of people working as machinery operators also increased by three people, making up 18.9 per cent of the workforce in 2021 compared to 12.6 per cent in 2016.
The number of clerical and administrative workers stayed static between 2016 and 2021, with three people in the workforce for this occupational category.
The largest decrease was seen amongst professionals, making up 20.7 per cent (18 people) of the work force in 2016, which reduced to 8.1 per cent (six people) of the workforce in 2021, a reduction of 66.6 per cent.

Between 2016 and 2021, there are 17 less people working full time, a decrease of 16.6 per cent, and a slight decrease of people working part time of 2.2 per cent or one person.
The number of unemployed people has fallen by 61 per cent which equates to 11 people. The largest change has been in those that have not stated their labor force which has seen a 128 per cent increase, or 18 people.
The top five occupational categories of employment in 2021 were community and personal service workers (23 per cent), technicians and trades workers (21.6 per cent), machinery operators (18.9 per cent), followed by labourers and professionals (8.1 per cent), managers (6.8 per cent) and clerical and administrative workers (4.1 per cent).
In 2016, the top five occupational categories of employment were machinery operators and drivers, labourers, technicians and trade workers, professionals and sales workers.
The top five industries of employment in 2021 were manufacturing, transport, postal and warehousing, construction, and three with equal results retail trade, accommodation and food services and public administration and safety.
The top five industries of employment in 2016 were manufacturing, construction, accommodation and food services, transport, postal and warehousing, and rental, hiring and real estate services.
The wholesale trade industry experienced the highest growth at 200 per cent over the five year Census period, with mining, electricity, gas, water and waste services, and rental hiring and real estate services and professional, scientific and technical services all experiencing a 100 per cent decline with no residents working in these fields in 2021.

The percentage of the workforce that works over 35 hours has remained static between 2016 and 2021 at 60 per cent and 60.1 per cent.
Just over 90 per cent of workers travel to their place of work by car, either as driver or passenger.
Considerations:
- Sixty per cent of the employed community work over 35 hours per week and therefore may need access to services either outside working hours or on weekends.

| Industry |
2021 Pop |
% pop |
2016 Pop |
% pop |
% Change 2016- 2021 |
| Agriculture, Forestry and Fishing |
9 |
6.3 |
6 |
3.9 |
50.0% |
| Mining |
0 |
0 |
6 |
3.9 |
-100.00% |
| Manufacturing |
21 |
14.7 |
22 |
14.2 |
-4.5% |
| Electricity, Gas, Water and Waste Services |
0 |
0 |
7 |
4.5 |
-100.0% |
| Construction |
15 |
10.5 |
16 |
10.3 |
-6.3% |
| Wholesale Trade |
9 |
6.3 |
3 |
1.9 |
200.0% |
| Retail Trade |
11 |
7.7 |
7 |
4.5 |
57.1% |
| Accommodation and Food Services |
11 |
7.7 |
13 |
8.4 |
-15.4% |
| Transport, Postal and Warehousing |
16 |
11.2 |
12 |
7.7 |
33.3% |
| Information Media and Telecommunications |
0 |
0 |
0 |
0 |
0.0% |
| Financial and Insurance Services |
0 |
0 |
0 |
0 |
0.0% |
| Rental, Hiring and Real Estate Services |
0 |
0 |
10 |
6.5 |
-100.0% |
| Professional, Scientific and Technical Services |
0 |
0 |
4 |
2.6 |
-100.0% |
| Administrative and Support Services |
3 |
2.1 |
3 |
1.9 |
0.0% |
| Public Administration and Safety |
11 |
7.7 |
8 |
5.2 |
37.5% |
| Education and Training |
10 |
7 |
6 |
3.9 |
66.7% |
| Health Care and Social Assistance |
10 |
7 |
7 |
4.5 |
42.9% |
| Arts and Recreation Services |
0 |
0 |
0 |
0 |
0.0% |
| Other Services |
4 |
0.4 |
6 |
3.9 |
-33.3% |
| Inadequately described/Not stated |
9 |
6.3 |
6 |
3.9 |
50.0% |
Source: ABS Census 2021
The Mount Larcom community has a lower socio-economic profile in comparison to the Gladstone Region.
- The median weekly household income is $1,268 compared to $1,693 for the Gladstone Region.
- 23.8 per cent of households earn $3,000 or more per week compared to 19.8 per cent for the Gladstone Region
- 9.1 per cent of households earn less than $650 each week compared to 7.2 per cent for Gladstone Region.
- 19.4 per cent of non-family households earn less than $650 each week compared to 47.0 per cent for Gladstone Region.
In 2021, 53.5 per cent of the Mount Larcom population over 15 were in the labour force, which is an increase of 6.15 per cent from the 2016 Census.
The labour force within the Mount Larcom township consists of 143 employed people, with the majority working full time. 7 people are unemployed, however actively looking for work; 89 are not in the labour force and 32 do not state their employment status.
The unemployment rate for the Mount Larcom community has decreased by 51 per cent (11 people) between 2016 and 2021.
In 2021, 38.7 per cent of households fully owned their housing which is slightly lower than the Gladstone Region at 29.1 per cent. There was a minimal increase in the number of people that fully own their own house, with an increase of two.
In 2021, 42 per cent of households had a mortgage in Mount Larcom, compared to 37 per cent for Gladstone Region and 34.4 per cent for the State. The number of households that own a home with a mortgage increased by two homes between 2016 and 2021.
Data from 2021 shows 14.3 per cent of dwellings were rented in Mount Larcom compared to 45.0 per cent in the Gladstone Region. These rentals are provided by a person that does not live in the household.
In 2016, 17.8 per cent (24) of homes were rented from a community housing provider and three per cent (four homes) were rented from a real estate. In 2021 no homes were rented from a community housing provider or real estate.
The average mortgage repayment is $1,300 which is lower than the Gladstone Region by $300 and $433 lower than the State. There has been a $242 reduction in average mortgage payments between 2016 and 2021.
There are shifts across multiple mortgage payment brackets. The percentage of the population paying $0-299 has increased by four households. In addition, the percentage of the population paying $1,400-$1,799 and $1,800-$2,399 has decreased by five households and nine households respectively.
There were increases in the percentage of the community with mortgage payments in the following brackets between 2016 and 2021; $600-$799 (four households), $1,000-$1,399 (12 households), $3,000-$3,999 (five households), $4,000 and over (five households).
The median rent for Mount Larcom in 2021 was $190 compared to $275 in the Gladstone Region and $365 in the State. The median rent in Mount Larcom has reduced by $35 since 2016.
Over the five year period, there has been a reduction of 28 per cent of rental properties, (2016, 32 properties; 2021, 23 properties).
The majority of rentals in the Mount Larcom township are rented privately by persons not in the same household.
Considerations:
- Mount Larcom has a significantly lower average weekly income than the region and a higher proportion of families earning less than $650 a week, coupled with a higher proportion of households with a mortgage. Consideration should be given to affordability and accessibility to services, programs and activities.
Rental prices in 2021 have remained reasonable in this area, ranging from $100-$224 across the 23 properties.
| Prices |
2021 |
% |
2016 |
% |
% change 2016-2021 |
| $1-$74 |
0 |
0 |
4 |
11.1 |
-100.0% |
| $75-$99 |
0 |
0 |
0 |
0 |
0.0% |
| $100-$149 |
3 |
13 |
5 |
13.9 |
-40.0% |
| $150-$199 |
3 |
13 |
6 |
16.7 |
-50.0% |
| $200-$224 |
3 |
13 |
4 |
11.1 |
-25.0% |
| $225-$274 |
5 |
21.7 |
5 |
13.9 |
0.0% |
| $275-$349 |
0 |
0 |
8 |
22.2 |
-100.0% |
| $350-$449 |
0 |
0 |
0 |
0 |
0.0% |
| $450-$549 |
0 |
0 |
0 |
0 |
0.0% |
| $550-$649 |
0 |
0 |
0 |
0 |
0.0% |
| $650-$749 |
0 |
0 |
0 |
0 |
0.0% |
| $750-$849 |
0 |
0 |
0 |
0 |
0.0% |
| $850-$949 |
0 |
0 |
0 |
0 |
0.0% |
| $950 and over |
0 |
0 |
0 |
0 |
0.0% |
| Rent not stated |
0 |
0 |
0 |
0 |
0.0% |
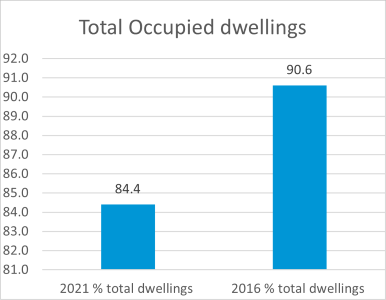
84.4 per cent dwellings are occupied in Mount Larcom, compared with 85 per cent in the Gladstone Region.
Between 2016 and 2021 there has been a decrease of 6.8 per cent (16) in the percentage of dwellings that are occupied.
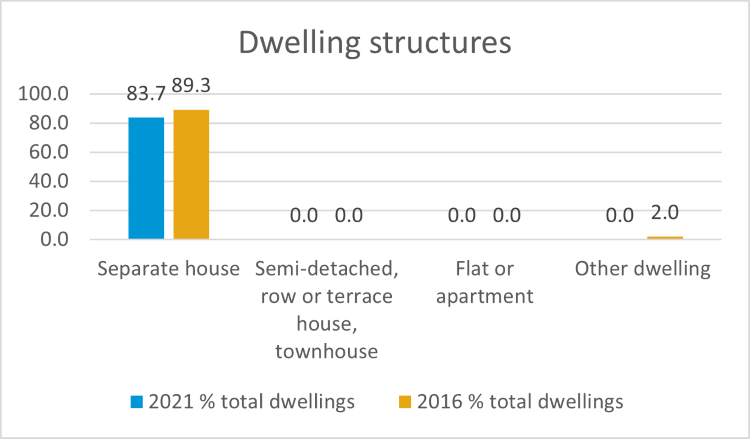
Most (83.7 per cent) of the housing in Mount Larcom is separate houses, which is 15 per cent higher than the Gladstone Region (72.7 per cent). Between 2016 and 2021, there has been a decrease in the number of separate houses reported in the Census, with a decrease of 15 dwellings.
| Occupancy |
|
2021 % total dwellings |
2016 % total dwellings |
| Total occupied dwellings |
84.4% |
90.6% |
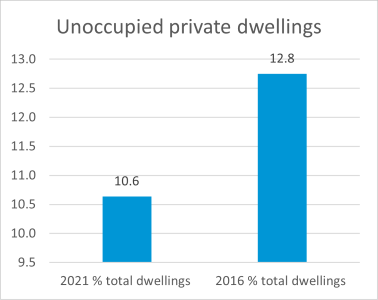
| Unoccupied private dwellings |
10.6% |
12.8% |
3.9 per cent of the community requires assistance with core activities. This represents 13 people.
The number of people requiring assistance has decreased by 11 people in the five-year duration between the 2016 and 2021 Census, a decrease of 45.8 per cent.
In addition, the number of people that have 'not stated' a need for assistance has increased by 86.4 per cent in 2021, which represents 19 people.
The 2021 Census data does not provide a detailed breakdown of age brackets for those community members that need assistance, this is likely due to the low numbers and the potential for identification within such a small sample size and community.
In 2021 there were 33 people providing unpaid assistance to a person with a disability, health condition or due to old age which is an increase of five people from 2016.
There are a number of changes in the age brackets of those providing unpaid assistance, the general trend sees less young people providing assistance and more older people providing assistance. With a reduction of nine people for those aged 35-44, representing a 78.7 per cent reduction, for those aged 44-54 there was a reduction of 33 per cent representing two people. One less person provided support for people aged 55-64.
In 2016, 14.3 per cent of people that provided assistance were aged 65-74, increasing to 21.2 per cent in 2021 which is an increase of three people or 75 per cent. One more person aged 75-84 provided assistance in 2021 compared to 2016.
The percentage of the population in Mount Larcom that are providing unpaid assistance is higher than both the region and State across all age brackets except for the those aged 15-34 and 85 years and older.
Considerations:
- There is a need to continue to support community members who have a disability or require assistance as carers.
- Given the increases in seniors and elderly people providing unpaid support, consideration needs to be given around aging in place supports.
|
2021 |
% |
2016 |
% |
% change 2016-2021 |
| Has need for assistance 2021 |
13 |
3.9 |
24 |
6.6 |
-45.8% |
| Does not have need for assistance 2021 |
279 |
84 |
317 |
87.8 |
-12.0% |
| Need for assistance not stated 2021 |
41 |
12.3 |
22 |
6.1 |
86.4% |
Volunteering is strong in the Mount Larcom community with 60 (22.5 per cent) people aged 15 years and over providing volunteer services. This compares to 16.2 per cent for the Gladstone Region.
Volunteering in Mount Larcom is strong and the number of volunteers has stayed almost static, with 60 volunteers in 2021 and 62 in 2016.
There has been minimal change across ages of volunteers in Mount Larcom, with the exception of the 55-64 age bracket, which made up 25.8 per cent (16) of volunteers in 2016, reducing to 21.7 per cent (13) volunteers in 2021.
There has been a significant increase of those aged 65-74 volunteering, making up 14.5 per cent (nine) of volunteers in 2016 compared to 30 per cent or 18 people in 2021. This equates to 36.7 per cent of people from Mount Larcom in this age bracket volunteering.
With a population just over 300, the Mount Larcom community is heavily reliant on volunteers with almost a quarter of the community volunteering.
The largest event or activity that is delivered by volunteers in Mount Larcom is the Mount Larcom Show, which has been running for 103 years.
Considerations:
- Over half of the community members that volunteer are aged over 54. Consideration need to be given to the impact on community organisations and events, with less young people volunteering.
Council regularly undertake a Community Satisfaction Survey to identify community sentiment with respect to its assets, services and programs.
|
Mount Larcom |
Gladstone Region |
LGA Benchmark |
| Overall satisfaction |
56.0% |
55.0% |
55.7% |
|
|
|
|
| ASSETS |
|
|
|
| (1 = very dissatisfied – 100= very satisfied) |
|
|
|
| Landfills and waste management facilities |
66.2% |
72.9% |
70.2% |
| Art Galleries and museums |
66.5% |
72.7% |
70.7% |
| Public toilets and amenities |
61.4% |
69.1% |
67.7% |
| Libraries |
74.6% |
79.7% |
78.0% |
| Airports and aerodromes |
71.2% |
70.8% |
70.1% |
| Parking facilities and street parking |
57.5% |
66.0% |
65.7% |
| Performing arts centres |
68.0% |
69.1% |
69.0% |
| Lighting and signage |
60.4% |
68.3% |
68.9% |
| Beaches and coastal areas |
66.4% |
73.1% |
73.7% |
| Landscapes and streetscapes |
72.0% |
69.5% |
70.1% |
| Halls and community centres |
63.4% |
70.7% |
72.2% |
| Stormwater and flood control system |
57.3% |
65.8% |
67.1% |
| Water and sewerage system |
61.8% |
69.4% |
71.5% |
| Boat ramps and jetties |
61.0% |
68.8% |
71.0% |
| Parks and open space |
65.4% |
72.3% |
75.0% |
| Footpaths and cycleways |
56.8% |
65.4% |
68.1% |
| Local roads and bridges |
53.8% |
63.0% |
65.8% |
| Sport and recreation facilities |
61.3% |
69.1% |
73.2% |
| Camping grounds and caravan parks |
55.8% |
64.6% |
68.9% |
| Swimming pools and aquatic centres |
52.5% |
62.0% |
71.5% |
|
|
|
|
| SERVICES |
|
|
|
| (1 = very dissatisfied – 100= very satisfied) |
|
|
|
| Emergency and disaster management |
63.8% |
71.0% |
71.0% |
| Waste services |
68.1% |
74.5% |
74.0% |
| Customer service |
61.6% |
69.3% |
69.7% |
| Consulting with the community |
49.7% |
59.7% |
61.1% |
| Building services |
67.6% |
62.8% |
64.8% |
| Animal management services |
54.5% |
63.6% |
66.1% |
| Informing the community of council decisions |
52.1% |
61.7% |
64.4% |
| Financial management |
47.8% |
58.2% |
61.1% |
| Environmental management |
53.6% |
62.8% |
66.4% |
| Making and enforcing local laws |
51.2% |
60.9% |
64.9% |
| Advocating on behalf of the community |
52.8% |
59.9% |
64.2% |
| Making decisions in the best interest of the community |
46.6% |
57.3% |
61.5% |
| Community services |
55.5% |
64.4% |
69.8% |
| Planning and development approval |
47.0% |
57.6% |
62.5% |
| Infrastructure and property services |
49.4% |
59.5% |
64.8% |
| Public health services |
54.8% |
63.8% |
71.0% |
| Biosecurity and environmental health |
50.1% |
60.1% |
66.8% |
|
|
|
|
| INITIATIVES |
|
|
|
| (1%: Far too little – 100%: Far too much) |
|
|
|
| Affordable housing development |
40.7% |
52.5% |
49.7% |
| Community safety and crime prevention |
34.8% |
47.9% |
47.5% |
| Creative arts development |
49.2% |
59.3% |
59.2% |
| Celebration of multiculturalism |
51.1% |
60.9% |
61.5% |
| Celebration of First Nation culture |
53.0% |
62.4% |
63.3% |
| Heritage conservation |
42.2% |
53.7% |
55.1% |
| Tourism development and promotion |
45.1% |
56.1% |
57.3% |
| Placemaking to create lively public spaces |
42.9% |
54.3% |
55.9% |
| Environmental conservation and climate change action |
43.7% |
55.0% |
56.8% |
| Waste minimisation and recycling |
40.3% |
52.2% |
54.4% |
| Children and youth development |
38.3% |
50.6% |
53.6% |
| Childcare |
42.7% |
54.1% |
57.6% |
| Skill development and networking opportunity |
38.6% |
50.9% |
54.5% |
| Newcomer attraction and retention |
39.7% |
51.8% |
55.6% |
| Aged care and accommodation |
26.6% |
41.3% |
50.3% |
Mount Larcom Pool
Mount Larcom pool is an ageing asset which is open to the public from September through to April.
Although at the time of this report, it is only the beginning of the season, patronage numbers for October are down on the previous two years, with 182 patrons in FY21, 281 in FY22 and 154 FY23.
Mount Larcom Rural Transaction Centre is open from 8:30am-5pm Monday to Friday, for the community to access:
- Council Services
- Justice of the Peace
- Library
- Post office
- Services Australia
Customer Service Requests
The Mount Larcom Community engaged with Council on the following top 20 customer service requests from 30 June 2021 to 1 July 2022.
| CSR Type |
Count of CSR Type |
| Gravel Road Repair (corrugations/stones/ruts/dust) |
64 |
| Waste Admin Haulage for Transfer Stations |
51 |
| Repair / Replacement of Wheelie Bin Request |
34 |
| Request to change address / details |
29 |
| Development services enquiries |
22 |
| Animal Registration Enquiry / Compliance Matter |
16 |
| Stray / Wandering Livestock - Cattle & Horses |
16 |
| Leak on Footpath / Road |
14 |
| Information Request General |
13 |
| Tree Request and Enquiries on Council Land |
11 |
| Debris on Road - tree / object / non-toxic liquid / sharps |
10 |
| Hydrant and Other Water Infrastructure Defects |
10 |
| Missed Wheelie Bin / Collection Problem |
10 |
| New Initial / Additional Kerbside Collection Levy |
10 |
| Public Amenities / Toilets (NOT water & sewerage) |
10 |
| Water Meter Enquiry/Issues/Reading |
10 |
| Public Waste Services Miscellaneous Request |
8 |
| New Rural Street Address and Replacement Marker |
7 |
| Overgrown Land - Roadside Slashing |
7 |
| Sealed Road Repair (bitumen, potholes, defects) |
7 |
| Total |
359 |
Rate Arrears
Mount Larcom’s socio-economic position is lower than that of the broader Gladstone Region.The median weekly household income for Mount Larcom is $1,268 compared to $1,693 for the Gladstone Region.
Mount Larcom also has a higher proportion of households with a mortgage compared to the region, being 42 per cent compared to 36.5 per cent for the region.
Residential rate arrears are in the higher end of the scale, with 29 properties in arrears as at 30 October 2021 this 2.3 per cent higher than 30 June 2022.The total number of rateable residential properties in Mount Larcom is 174.On average, 16.7 per cent of households have outstanding rate payments as at 31 October 2022.
On 30 June 2022, 9.5 per cent of rateable commercial properties (four properties) were in arrears. This decreased to 3 rate payers as of 31 October 2022.
Education
Mount Larcom State Primary School
Prep - Year 10
Co-educational
412 enrolments (August. 2021)
Community Facilities
Mount Larcom Library & Rural Transaction Centre
47 Raglan Street, Mount Larcom
Monday to Friday 9am-1pm & 2pm-5pm, Saturday 9am-noon
- Gladstone Regional Council services
- Library
- Australia Post
- Medicare claim point
- Centrelink contact point
Mount Larcom Public Hall
8 Bismark Street, Mount Larcom
Mount Larcom Youth Centre
15 The Narrows Road, Mount Larcom
Mount Larcom QCWA Hall
King George Street, Mount Larcom
Mount Larcom Show Grounds
31 The Narrows Road, Mount Larcom
Mount Larcom Swimming Pool
15 The Narrows Road, Mount Larcom
Mount Larcom Tennis Courts
15 The Narrows Road, Mount Larcom
Community Groups
- QCWA Mount Larcom Branch
- Returned and Services League (Mt Larcom Sub Branch)
- Mount Larcom and District Show Society Inc.
- Mount Larcom Progress Association
Sporting Groups
- Mount Larcom Ladies Bowling Club Inc.
- Mount Larcom Bowls Club
- Mount Larcom & District Fishing Club
- Curtis Horse Trail Riding Club Inc
- Silver Spurs Western Performance & Quarter Horse Club Inc.
Community-Led Events
- Mount Larcom Show
- Mount Larcom Show Ball
- Mount Larcom & District Christmas Carnival
Parks
- Dudge and Isabel Barram Park, Raglan Street
- Pincham Park, 5 Davis Street
- Golding Park, The Narrows Road
Sport & Recreation
- Mount Larcom Swimming Pool
- Mount Larcom Tennis Court
- Recreation area and outdoor fitness