An hour’s drive from Gladstone, the Boyne Valley is a rural community with the small townships of Nagoorin, Ubobo, Builyan and Many Peaks dotted along the Boyne River, the heart of the valley. The Boyne River, Awoonga Dam and a network of National Parks and forests combine to create a place of great natural beauty. The area is home to a number of community-led events, such as the Boyne Valley Music Campout, the Boyne Valley Showcase and the Boyne Burnett Inland Rail Trail.
Compared to the Gladstone Region and Queensland, Boyne Valley has:
- The median age of the Boyne Valley is 56 and has increased by 10 years since 2011 and is 18 years higher than the region and State.
- The Boyne Valley has limited cultural diversity, with no community members from non-English speaking backgrounds.
- There is an increasing proportion of couples without children, which is significantly higher than the region and more than double than the State.
- Average data highlights a significantly lower household income when compared to the region and the State.
| Data focus |
Boyne Valley |
Gladstone Region |
Queensland |
|
2021 |
2016 |
2011 |
Change 2021- 2011 |
Change 2021- 2016 |
Change 2016- 2011 |
2021 |
2021 |
| Median Age |
56 |
48 |
46 |
10 Years |
8 years |
2 year |
38 |
38 |
| Non English-speaking backgrounds |
0% |
0% |
0% |
0.00% |
0.00% |
0.00% |
5% |
12.6% |
| Couple Family with children |
28.2% |
25.3% |
32% |
-11.88% |
11.46% |
-20.94% |
41.7% |
55.4% |
| Couple Family without children |
61.2% |
56.8% |
55.7% |
9.87% |
7.75% |
1.97% |
40.5% |
28% |
| Average number of people per household |
2.1 |
2.3 |
2.2 |
-4.55% |
-8.70% |
4.55% |
2.5 |
2.5 |
| Household with a mortgage |
22.5% |
30.6% |
17.8% |
26.40% |
-26.47% |
71.91% |
37% |
34.4% |
| Households renting |
8.7% |
14.9% |
8.9% |
-2.25% |
-41.61% |
67.42% |
33.4% |
33% |
| Median weekly household income |
$1,468 |
$1,233 |
$1,078 |
36.18% |
19.06% |
14.38% |
$1,639 |
$1,675 |
| Median monthly mortgage repayments |
$1,083 |
$1,161 |
$1,136 |
-4.67% |
-6.72% |
2.20% |
>$1,600 |
$1,733 |
| Median weekly rent (overall) |
$160 |
$130 |
$75 |
113.33% |
23.08% |
73.33% |
$275 |
$365 |
| University attendance |
0% |
0% |
0% |
0.00% |
0.00% |
0.00% |
7.2% |
14.2% |
In 2021 the Boyne Valley population was 301. Since 2011, the population of the Boyne Valley has decreased by 80 people.
In 2021, the median age of the Boyne Valley community was 56, compared to 48 in 2016 and 46 in 2011. This is higher than the region and the State, both with a median age of 38.
There have been movements across all age brackets which has highlighted an ageing population.
Over the past five years, there has been a transition from a younger family demographic to over 55s living.
In the Census period, there has been a decline in residents aged 0-49 of 41.7 per cent, or 81 people.
Offsetting this decline is an increase in community aged 50-85+, increasing by 11.2 per cent, and an additional 19 people.
The age categories with significant decline are the 30-34 years, decreasing by 80.9 per cent, with 21 people in 2016 and just 4 in 2021.
Likewise, there has been a significant decrease in young people, 0-4 years has declined by 72.4 per cent; 10-14 years by 60.8 per cent and 15-19 by 50 per cent.
There has been a significant increase in community members aged 75-79, with an uplift of 157.1%, equalling an additional 11 people.
There has also been an increase in the 60-64 years age bracket, with an increase of 36.6 per cent totalling 12 people.
In 2021 the age groups that differ most to the Gladstone Region are:
- Parents and home builders are under-represented in the Boyne Valley at 16.6 per cent of the population, in comparison to 26.6 per cent in the region.
- Babies, preschoolers, primary and secondary schoolers are less prominent in the Boyne Valley community, representing 2.7 per cent and 14.6 per cent respectively. Gladstone Region has an average of 6.4 per cent babies and pre-schoolers and 28.8 per cent of primary and secondary schoolers.
- Empty nesters and retirees are well represented in the Boyne Valley in comparison to the region at 23.6 per cent, compared to Gladstone Region of 13.6 per cent.
- There is a much higher proportion of Seniors living in the Boyne Valley, 18.6 per cent, in comparison to the region at 7.8 per cent.
Consideration needs to be given to the ageing population and the reduction in younger members of the community which will mean an increasing demand on services for older community members.

| Age |
Boyne Valley |
Gladstone Region |
Queensland |
|
2021 Pop |
% pop |
2016 Pop |
% pop |
% Change 2021 - 2016 |
2021 Pop |
% pop |
2021 Pop |
% pop |
| Median age |
|
N/A |
|
N/A |
N/A |
38 |
N/A |
38 |
N/A |
| 0-4 years |
8 |
1.2 |
29 |
3.7 |
-72.41% |
4,049 |
6.4 |
292,452 |
5.7 |
| 5-9 years |
27 |
2 |
23 |
4.2 |
17.39% |
4,686 |
7.4 |
329,311 |
6.4 |
| 10-14 years |
9 |
3.4 |
23 |
5.9 |
-60.87% |
4,913 |
7.7 |
342,560 |
6.6 |
| 15-19 years |
8 |
4.1 |
16 |
2 |
-50.00% |
4,001 |
6.3 |
313,506 |
6.1 |
| 20-24 years |
5 |
2.6 |
13 |
2.9 |
-61.54% |
3,159 |
5 |
323,739 |
6.3 |
| 25-29 years |
6 |
2 |
4 |
1.8 |
50.00% |
3,766 |
5.9 |
347,687 |
6.7 |
| 30-34 years |
4 |
1.2 |
21 |
2.4 |
-80.95% |
4,066 |
6.4 |
354,033 |
6.9 |
| 35-39 years |
18 |
2.2 |
18 |
2.6 |
0.00% |
4,280 |
6.7 |
357,120 |
6.9 |
| 40-44 years |
15 |
5.3 |
20 |
4.6 |
-25.00% |
4,069 |
6.4 |
330,692 |
6.4 |
| 45-49 years |
13 |
8.3 |
27 |
8.8 |
-51.85% |
4,518 |
7.1 |
340,287 |
6.6 |
| 50-54 years |
31 |
10.1 |
24 |
9.6 |
29.17% |
4,546 |
7.2 |
333,843 |
6.5 |
| 55-59 years |
24 |
16.2 |
38 |
14.7 |
-36.84% |
4,524 |
7.1 |
316,378 |
6.1 |
| 60-64 years |
45 |
13.8 |
33 |
12.5 |
36.36% |
4,154 |
6.5 |
298,919 |
5.8 |
| 65-69 years |
26 |
10.7 |
34 |
10.3 |
-23.53% |
3,190 |
5 |
264,515 |
5.1 |
| 70-74 years |
30 |
8.5 |
22 |
9.5 |
36.36% |
2,532 |
4 |
238,952 |
4.6 |
| 75-79 years |
18 |
5.7 |
7 |
2.6 |
157.14% |
1,507 |
2.4 |
168,385 |
3.3 |
| 80-84 years |
8 |
2.4 |
8 |
2.2 |
0.00% |
886 |
1.4 |
106,611 |
2.1 |
| 85 years and over |
6 |
0.6 |
3 |
0 |
100.00% |
679 |
1.1 |
97,140 |
1.9 |
| Group |
Age |
Boyne Valley |
Gladstone Region |
|
|
2021 |
% pop |
2016 |
% pop |
2011 |
% pop |
% Change 2021- 2011 |
% Change 2021- 2016 |
% Change 2016- 2011 |
2021 |
% pop |
| Babies and pre-schoolers |
0-4 yrs |
8 |
2.7 |
29 |
8.1 |
21 |
5.5 |
-61.90% |
-72.41% |
38.10% |
4,049 |
6.4% |
| Primary and secondary schoolers |
5-19 yrs |
44 |
14.6 |
62 |
17.3 |
63 |
16.5 |
-30.16% |
-29.03% |
-1.59% |
13,600 |
28.8% |
| Tertiary education and independence |
20-24 yrs |
5 |
1.7 |
13 |
3.6 |
9 |
2.4 |
-44.44% |
-61.54% |
44.44% |
3,159 |
5.0% |
| Young workforce |
25-29 yrs |
6 |
2 |
4 |
1.1 |
17 |
4.5 |
-64.71% |
50.00% |
-76.47% |
3,766 |
5.9% |
| Parents and home builders |
30-49yrs |
50 |
16.6 |
86 |
24 |
101 |
26.5 |
-50.50% |
-41.86% |
-14.85% |
16,933 |
26.6% |
| Older workers and retirees |
50-59 yrs. |
55 |
18.3 |
62 |
17.3 |
68 |
17.8 |
-19.12% |
-11.29% |
-8.82% |
9,070 |
14.3% |
| Empty nesters and retirees |
60-69 yrs |
71 |
23.6 |
67 |
18.7 |
64 |
16.8 |
10.94% |
5.97% |
4.69% |
7,344 |
13.6% |
| Seniors |
70-84 yrs |
56 |
18.6% |
37 |
10.3% |
35 |
9.2% |
60.00% |
51.35% |
5.71% |
4,925 |
7.8% |
| Elderly aged |
85+ |
6 |
2 |
3 |
0.8 |
3 |
0.8 |
100.00% |
100.00% |
0.00% |
679 |
1.1% |
Service group breakdown compared to the Region, source ABS 2022, 2016
The communities of the Boyne Valley have diverse household types with the main group being couples without children.

In 2021 the percentage of couple families with children was 28.2 per cent which is significantly lower than the region at 41.7 per cent and the State at 41.2 per cent.
The number of couple families with children was 32 in 2011, which was 32 per cent of families. The number of families dropped to 24 in both 2016 and 2021. In 2016 this represented 25.3 per cent of families and 28.2 per cent in 2021.
The number of couple families without children has decreased over time and while the number of families has decreased, they represent a larger percentage of the population. This is due to the decreasing number of families living in the Boyne Valley.
There has been minimal change between the number of one parent families, staying static at 10 between 2011 and 16 and increasing to 11 in 2021. Representing 9.4 per cent, 10.5 per cent and 12.9 per cent of families in 2011, 2016 and 2021. These figures are slightly lower than the region.
The number of one parent families is 12.9 per cent (11 families) which is lower than the region at 16.6 per cent but higher when compared to the State which sits at 9.1 per cent.
There was minimal change in the number of one parent families, from 10 in 2011 and 2016, increasing to 11 in 2021.
There are 112 people in a registered marriage in the Boyne Valley, which is 50.2 per cent of the population - 15.1 per cent higher than the region at 43.6 per cent.
There has been a 33.7 per cent reduction in the population in a registered marriage between 2011 and 2021, which equates to 57 people.
The percentage of the population that are not married has increased from 28.1 per cent in 2011 to 30 per cent in 2016, increasing further in 2021 to 35.4 per cent, an increase of five people or 6.76 per cent.
The number of people in a de-facto marriage increased from 20 in 2011 to 33 in 2016, reducing to 29 in 2021. This is an increase of 45 per cent across the 10 years and is consistent with the regional average.
Considerations:
- Health and wellbeing for an ageing population should be a focus. Connection opportunities for seniors would also be appropriate for the Boyne Valley.
Family composition
| Boyne Valley |
Gladstone Region |
Queensland |
|
2021 |
% pop |
2016 |
% pop |
2011 |
% pop |
% Change 2011 - 2021 |
% Change 2016 - 2021 |
% Change 2011 - 2016 |
2021 pop |
% pop |
2021 pop |
% pop |
| Couple family without children |
52 |
61.2 |
54 |
56.8 |
29 |
55.66038 |
-11.86% |
-3.70% |
-8.47% |
6,829 |
40.5% |
551,069 |
40.3% |
| Couple family with children |
24 |
28.2 |
24 |
25.3 |
34 |
32.07547 |
-29.41% |
0.0% |
-29.41% |
7,021 |
41.7% |
563,327 |
41.2% |
| One parent family |
11 |
12.9 |
10 |
10.5 |
10 |
9.433962 |
10.0% |
10.0% |
0.0% |
2,798 |
16.6% |
124,174 |
9.1% |
| Other family |
0 |
0 |
0 |
0 |
3 |
2.830189 |
-100.0% |
0.0% |
-100.0% |
202 |
1.2% |
46707 |
3.4% |
Social Marital Status
| Boyne Valley |
Gladstone Region |
|
2021 |
% pop |
2016 |
% pop |
2011 |
% pop |
% Change 2011 - 2021 |
% Change 2016 - 2021 |
% Change 2011 - 2016 |
2021 |
% pop |
| Registered marriage |
112 |
50.2 |
136 |
57.4 |
169 |
64.3 |
-33.73% |
-17.65% |
-19.53% |
20,253 |
43.6% |
| De facto marriage |
29 |
13 |
33 |
13.9 |
20 |
7.6 |
45.0% |
-12.12% |
65.0% |
6,476 |
14.8% |
| Not married |
79 |
35.4 |
71 |
30 |
74 |
28.1 |
6.76% |
11.27% |
-4.05% |
16,998 |
38.8% |
Source: ABS 2022, 2016, 2011
In 2021, 82.6% of the Boyne Valley population was born in Australia, compared to 79.6% in the Gladstone Region.

A further 5.2 per cent were born overseas from one other English-speaking country, being the United Kingdom. A further 9 per cent did not state their country of birth.
English was the only language spoken at home in the Boyne Valley.
The number and percentage of the population that are Aboriginal and Torres Strait Islander people has fluctuated over time.
In 2021, there were eight Aboriginal and Torres Strait Islander people, living in the Boyne Valley making up 2.7 per cent of the population. While in 2016 there were 14 (3.9 per cent of the population). The number was lower again in 2011, with nine Aboriginal and Torres Strait Islander people living in the Boyne valley which equated to 2.7 per cent of the population.
The main religious followings in the Boyne Valley are:
- 31.2% - No religion
- 23.6% - Anglican
- 21.6% - Catholic
- 3% - Uniting Church
- 2.7% - Presbyterian and Reformed
- 2% - Baptist
- 1.7% - Christianity, nfd
- 1.3% - Pentecostal
- 1% - Lutheran
In addition to 31.2 per cent of the community who stated they had no religion in 2021, a further 9 per cent did not respond.
This equates to 121 community members either with no religion or unknown and 177 who reported religious affiliation.
Anglican and Catholic religions were the most common, at 23.6 per cent Anglican and 21.6 per cent Catholic.
The main occupation categories for people aged 15 years and over in Boyne Valley are:
- 33.3% - Managers
- 20.3% - Machinery operators
- 14.6% - Labourers
- 11.4% - Clerical and administrative workers
- 11.4% - Technicians and Trade Operators Sales workers
- 7.3% - Community and personal service workers Professionals
- 5.7% - Inadequately described
There have been decreases in occupation categories across the ten-year Census period, primarily due to the continual decline in population of the Boyne Valley.
The top seven occupational categories have remained consistent, with the ranking slightly changing over the years.
Managers have remained as the most common occupation for the Boyne Valley across the ten-year period from 2011 to 2021. While it has remained the most prominent occupation, there has been a 35.9 per cent decrease in the amount of people practising this occupation, with 64 people in 2011 and 41 people in 2021.
The second most common occupation for the region was Machinery Operators, with an increase of 92 per cent from 2016 to 2021.
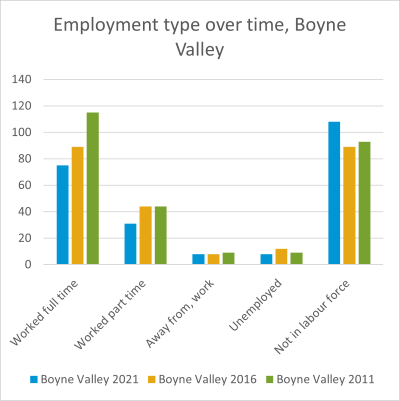
As indicated on the graph, it is evident that residents are choosing to age in place. Since 2011, there has been a decrease of 34.7 per cent of residents working full time, transitioning to the not in labour force category for retirement. There has been an increase of 16.1 per cent of residents in this category.
There has been a decrease in the unemployment rate in the Boyne Valley of 33 with 4.3 per cent of the population unemployed in 2016, and only 3.2 per cent in 2021.

In 2021, the top five ranked industries were Agriculture, Forestry and Fishing at 39 per cent, followed by Education and Training at 13.8 per cent. In third was Construction at 8.9 per cent, while in joint fourth was Manufacturing and other services making up 6.5 per cent of the workforce. There are three industries in equal fifth which were Administrative Support Services, Public Administration and Safety and Transport, Warehousing and Postal at 2.4 per cent.
In 2016, the top-ranking industries were Agriculture, Forestry and Fishing at 31.5 per cent, followed by Education and Training at 12.3 per cent, which were the same in 2021. Ranking third was Transport, Warehousing and Postal at 8.9 per cent, this was ranked joint fifth in 2021. Construction ranked fourth at 8.2 per cent compared to ranking third in 2021. In fifth ranking was Public Administration and Safety at 7.5 per cent, this industry also ranked fifth in 2021.

In 2011, Agriculture, Forestry and Fishing remained the highest-ranking industry of employment at 32.4 per cent, followed by Construction at 16.7 per cent. Construction did not rank in the top five in 2016 but ranked joint third in 2021. In joint third was by Education and Training and Professional, Scientific and Technical Services, both making up 8.3 per cent of workforce. Between 2021 and 2011 Professional, Scientific and Technical Services only ranked in the top5 once. This industry saw the second highest decrease, making up 8.3 per cent of the workforce in 2011, 5.5 per cent in 2016 and 0 per cent in 2021.
The largest decrease was seen in Manufacturing, making up 16.7 per cent of the workforce in 2011, 5.5 per cent in 2016 and 6.5 per cent in 2021. This represents a decrease of 55.5 per cent across the 10-year Census period.
The largest increases were seen in Agriculture, Forestry and Fishing, making up 32.4 per cent of the workforce in 2011, 31.5 per cent in 2016 and 39 per cent in 2021.
There has been a 7.9 per cent decrease in the number of employees working 35 hours or more between 2016 and 2021, a decrease of seven people. This means 65.9 per cent of the workforce work over 35 hours, with 34.1 per cent working more than 50 hours a week.
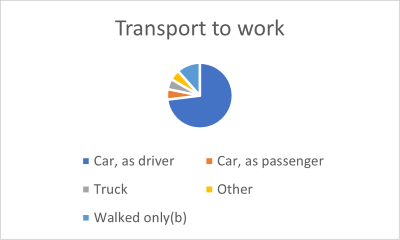
Data from the 2021 Census shows 80.3 per cent of workers travel to their place of work by car, either as driver or passenger.
Considerations:
- There is a large proportion of people working over 35 hours and 34.1 per cent working more than 50 hours. Consideration is to be given to the accessibility and timing of events, activities and programs
- A large proportion on the workforce are employed in Agriculture, Forestry and Fishing which can involve early starts and shift work. This can impact availability to attend events, programs and activities.
|
2021 pop |
% pop |
2016 pop |
% pop |
2011 pop |
% pop |
% change 2011-2021 |
% change 2016-2021 |
% change 2011-2016 |
| Managers |
41 |
33.3 |
41 |
28.1 |
64 |
35.4 |
-35.9% |
0.0% |
35.9% |
| Professionals |
0 |
0.0 |
5 |
3.4 |
9 |
5.0 |
-100.0% |
-100.0% |
-44.4% |
| Technicians and Trades Workers |
14 |
11.4 |
21 |
14.4 |
15 |
8.3 |
-6.6% |
-33.3% |
40.0% |
| Community and personal service workers |
9 |
7.3 |
8 |
5.5 |
12 |
6.6 |
-25.0% |
12.5% |
-33.0% |
| Clerical and administrative workers |
14 |
11.4 |
10 |
6.8 |
15 |
8.3 |
6.6% |
40.0% |
33.0% |
| Sales workers |
0 |
0.0 |
0 |
0.0 |
9 |
5.0 |
|
|
|
| Machine operators |
25 |
20.3 |
13 |
8.9 |
23 |
12.7 |
8.6% |
92.0% |
43.4% |
| Labourers |
18 |
14.6 |
35 |
24.0 |
28 |
15.5 |
-35.7% |
-48.5% |
25.0% |
| Industry |
2021 Pop |
% pop |
2016 Pop |
% pop |
2011 pop |
% pop |
% Change 2011- 2021 |
% Change 2016- 2021 |
% Change 2011- 2016 |
| Agriculture, Forestry and Fishing |
48 |
39.00 |
46 |
31.5 |
35 |
32.4 |
37.1% |
4.3% |
31.4% |
| Mining |
0 |
0.0 |
0 |
0.0 |
3 |
2.8 |
-100.0% |
0.0% |
-100.0% |
| Manufacturing |
8 |
6.5 |
8 |
5.5 |
18 |
16.7 |
-55.5% |
0.0% |
-55.5% |
| Electricity, Gas, Water and Waste Services |
0 |
0.0 |
3 |
2.1 |
3 |
2.8 |
-100.0% |
-100.0% |
0.0% |
| Construction |
11 |
8.9 |
12 |
8.2 |
6 |
5.6 |
83.3% |
-8.3% |
100.0% |
| Wholesale Trade |
0 |
0.0 |
0 |
0.0 |
3 |
2.8 |
0.0% |
0.0% |
-100.0% |
| Transport, Postal and Warehousing |
3 |
2.4 |
13 |
8.9 |
6 |
5.6 |
-50.0% |
-76.9% |
116.6 |
| Professional, Scientific and Technical Services |
0 |
0.0 |
8 |
5.5 |
9 |
8.3 |
-100.0% |
-100.0% |
-11.1% |
| Public Administration and Safety |
3 |
2.4 |
11 |
7.5 |
7 |
6.5 |
-57.1% |
-72.7% |
57.1%% |
| Education and Training |
17 |
13.8 |
18 |
12.3 |
9 |
8.3 |
88.8% |
-5.5% |
100.0% |
ABS Census Data, 2021, 2016, 2011
The combined data from the Boyne Valley has a socio-economic profile in line with the Gladstone Region.
- The median weekly household income is $1,468 compared to $1,693 for the Gladstone Region.
- 4 per cent of households earn $3,000 or more per week compared to 25.3 per cent for the Gladstone Region
- 6.2 per cent households earn less than $650 each week compared to 7.2 per cent for Gladstone Region.
- 49.5 per cent of non-family households earn less than $650 each week which is higher than the Region at 47.2 per cent.
In 2021, 48.6 per cent of households fully owned their home which was 56.1 per cent higher than the Gladstone Region at 27.3 per cent. There was a fluctuation in the proportions of households that own their home between 2021 and 2011. With 56.8 per cent (83 households) owning their home in 2011, compared to 48.5 per cent (65 homes) in 2016 and 48.6 per cent or 67 homes in 2021.
The population that owns their home with a mortgage increased by five households between 2011 and 2021. During the same period, the percentage of the population that owned their home with a mortgage fluctuated, being 17.8 per cent of households in 2011, 30.6 per cent in 2016 and reducing to 22 per cent in 2021.
Median mortgage repayments have decreased slightly in the Boyne Valley when comparing 2021 and 2011, there was a slight increase between 2011 and 2016.
The average monthly mortgage repayments in the Boyne Valley were $1,468 which is $479 lower than the Gladstone Region and lower than the State by $612.
Data has changed across half of the payment brackets; the biggest two decreases were seen in households paying $1,400 -$1,799 and $300-$449.
Households paying mortgages between $1,400-$1,799 reduced from 30.8 per cent of households in 2011, to 9.8 per cent in 2016 and 12.9 per cent in 2021. This is a reduction of four households between 2011 and 2021, or 50 per cent decrease.
Those paying $300-$499 represented 100 per cent less in 2021 compared to 2011, taking the number of households in this payment bracket from three to zero.
The largest increases were seen in those paying $4,000 and over as well as those paying $1,800-$2,399.
The number of households paying $4,000 and over, represented zero per cent of households in 2011 and 2016, increasing to 25.8 per cent of households in 2021, this equates to eight households or a quarter of all mortgaged households.
There has been an increase in households paying $1,800 -$2,399, increasing from 0% in 2011 to 14.6 per cent in 2016 and 16.1 per cent in 2021, an increase of 5 households.
There are minimal rentals in the Boyne Valley, with most rentals being provided by a known person not living in the household. In 2021, 12 properties (8.7 per cent of households) fell into this category, while in 2016 it was 17 properties (12.7 per cent of households) and in 2011 there were 13 properties (8.9 per cent of households) were rented from a known person.
There were no properties rented from a community housing provider or State housing authority in 2021, 2016 and 2011. No homes were rented from real estate agents in 2021 while three were rented from a real estate agent in 2016.
In 2021, 14 homes or 6.7 per cent of homes were rented from a person not in the same household, while in 2016, 11 homes were rented from people not in the same household, which is 6.1 per cent of homes.
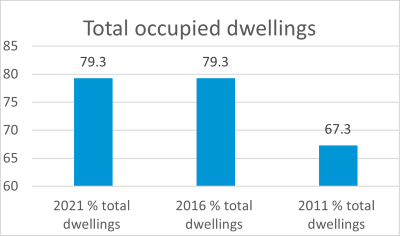
79.3 per cent of dwellings are occupied in the Boyne Valley compared with 85 per cent in the Gladstone Region.
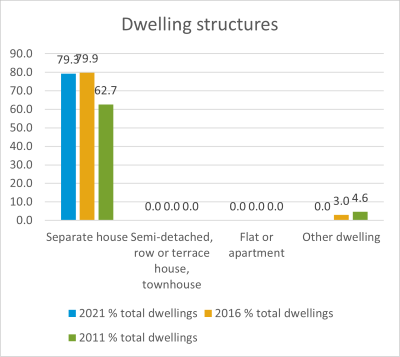
Most of the housing in the Boyne Valley is separate houses at 79.3 per cent, which is 6.7 per cent higher than the Gladstone Region. The percentage of properties that are separate houses has increased by 22.3 per cent since 2016. In 2016 there were 159 separate houses while in 2021 there were 209, an increase of 50.
There has also been a decrease in the number of ‘other’ dwellings. In 2016 these numbered 17, making up 5.9% of dwellings. In 2021 there were no ‘other’ dwellings.
In 2021, three per cent or eight households did not state their dwelling structure.
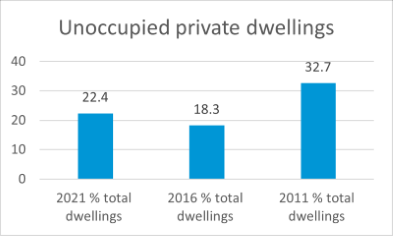
| Occupancy |
|
2021 % total dwellings |
2016 % total of dwellings |
2011 % total dwellings |
| Total occupied dwellings |
79.3 |
79.3 |
67.3 |
| Total unoccupied dwellings |
22.4 |
18.3 |
32.7 |
7.3 per cent of the community requires assistance with core activities, this represents 22 people.
The number of people requiring assistance has increased by six people between 2011 and 2016 and by one person between 2016 and 2021. Across the ten-year Census period, there has been an increase of 46.6 per cent in the population that need support with core activities.
In addition, the number of people that have 'not stated' need for assistance has decreased slightly over time, from 7.1 per cent (27 people) in 2011 to 11.7 per cent (42 people) in 2016, while in 2021 this reduced to 7 per cent or 21 people.
The largest proportion of people that required assistance with core activities in 2021 was those aged 65-74, making up 40.9 per cent (nine people) of those that need assistance. Followed by those aged 45-54 and 55-64, both representing 18.2 per cent (four people) of people that need assistance.
There are 45 people providing unpaid assistance to a person with a disability, health condition or due to old age within the Boyne Valley. There has been an increase of seven people providing unpaid assistance between 2011 and 2021.
There has been a general decrease in younger people providing unpaid assistance in the Boyne Valley, in 2011 there were three people (7.9 per cent of people) in each of the following age brackets: 15-19, 20-24, 25-34. This decreased to zero people in 2016 and 2021.
Those providing support are aging. The number of people providing support aged 55-64 increased from nine in 2011 to 19 in 2021, making up 42.2 per cent of those that provide support. The number of people providing assistance aged 65-74 also increased from six to 11 over the same period. A smaller increase was seen for people aged 75-84.
There are two times the amount of people providing unpaid assistance to those that require assistance with core activities in the Boyne Valley.
Considerations:
- The age of the population needing support is increasing as is the age of those providing support.
|
2021 |
% |
2016 |
% |
2011 |
% |
% Change 2011-2021 |
% Change 2016-2021 |
% Change 2011-2016 |
| Has need for assistance 2021 |
22 |
7.3 |
21 |
5.9 |
15 |
4 |
46.67% |
4.76% |
40.00% |
| Does not have need for assistance 2021 |
265 |
88 |
296 |
82.7 |
337 |
88.9 |
-21.36% |
-10.47% |
-12.17% |
| Need for assistance not stated 2021 |
21 |
7 |
42 |
11.7 |
27 |
7.1 |
-22.22% |
-50.00% |
55.56% |
Volunteering is high in the Boyne Valley with 79 people (32 per cent) aged 15 years and over providing volunteer services. This compares to 16.2 per cent for the Gladstone Region. One quarter of the overall Boyne Valley population volunteer.
The number of volunteers has decreased over time, being 30.2 per cent of the population (97 people) in 2011 compared to 92 (32.9 per cent) in 2016 and 79 people (31.8 per cent) in 2021.
The age of volunteers is increasing, since 2011 the proportion of volunteers that are 55 and over has increased by 47 per cent while the proportion of the volunteers aged under 54 has decreased by 58.7 per cent.
Council regularly undertakes a Community Satisfaction Survey to identify community sentiment with respect to its assets, services and programs.
|
Boyne Valley |
Gladstone Region |
LGA Benchmark |
| Overall satisfaction |
56.0% |
55.0% |
55.7% |
|
|
|
|
| ASSETS |
|
|
|
| (1 = very dissatisfied – 100= very satisfied) |
|
|
|
| Landfills and waste management facilities |
66.2% |
72.9% |
70.2% |
| Art Galleries and museums |
65.9% |
72.7% |
70.7% |
| Public toilets and amenities |
61.4% |
69.1% |
67.7% |
| Libraries |
74.6% |
79.7% |
78.0% |
| Parking facilities and street parking |
57.5% |
66.0% |
65.7% |
| Lighting and signage |
60.4% |
68.3% |
68.9% |
| Beaches and coastal areas |
66.4% |
73.1% |
73.7% |
| Halls and community centres |
63.4% |
70.7% |
72.2% |
| Stormwater and flood control system |
57.3% |
65.8% |
67.1% |
| Water and sewerage system |
61.8% |
69.4% |
71.5% |
| Boat ramps and jetties |
61.0% |
68.8% |
71.0% |
| Parks and open space |
65.4% |
72.3% |
75.0% |
| Footpaths and cycleways |
56.8% |
65.4% |
68.1% |
| Local roads and bridges |
53.8% |
63.0% |
65.8% |
| Sport and recreation facilities |
61.3% |
69.1% |
73.2% |
| Camping grounds and caravan parks |
55.8% |
64.6% |
68.9% |
| Swimming pools and aquatic centres |
52.5% |
62.0% |
71.5% |
|
|
|
|
| SERVICES |
|
|
|
| (1 = very dissatisfied – 100 = very satisfied) |
|
|
|
| Emergency and disaster management |
63.8% |
71.0% |
71.0% |
| Waste services |
68.1% |
74.5% |
74.0% |
| Customer service |
61.6% |
69.3% |
69.7% |
| Consulting with the community |
49.4% |
59.7% |
61.1% |
| Animal management services |
54.5% |
63.6% |
66.1% |
| Informing the community of council decisions |
52.1% |
61.7% |
64.4% |
| Financial management |
47.8% |
58.2% |
61.1% |
| Environmental management |
53.6% |
62.8% |
66.4% |
| Making and enforcing local laws |
51.2% |
60.9% |
64.9% |
| Making decisions in the best interest of the community |
46.6% |
57.3% |
61.5% |
| Community services |
55.5% |
64.4% |
69.8% |
| Planning and development approval |
47.0% |
57.6% |
62.5% |
| Infrastructure and property services |
49.4% |
59.5% |
64.8% |
| Public health services |
54.8% |
63.8% |
71.0% |
| Biosecurity and environmental health |
50.1% |
60.1% |
66.8% |
|
|
|
|
| INITIATIVES |
|
|
|
| (1: Far too little – 100: Far too much) |
|
|
|
| Affordable housing development |
40.7% |
52.5% |
49.7% |
| Community safety and crime prevention |
34.8% |
47.9% |
47.5% |
| Creative arts development |
49.2% |
59.3% |
59.2% |
| Celebration of multiculturalism |
51.1% |
60.9% |
61.5% |
| Celebration of First Nation culture |
53.0% |
62.4% |
63.3% |
| Heritage conservation |
42.2% |
53.7% |
55.1% |
| Tourism development and promotion |
45.1% |
56.1% |
57.3% |
| Placemaking to create lively public spaces |
42.9% |
54.3% |
55.9% |
| Environmental conservation and climate change action |
43.7% |
55.0% |
56.8% |
| Waste minimisation and recycling |
40.3% |
52.2% |
54.4% |
| Children and youth development |
38.3% |
50.6% |
53.6% |
| Childcare |
42.7% |
54.1% |
57.6% |
| Skill development and networking opportunity |
38.6% |
50.9% |
54.5% |
| Newcomer attraction and retention |
39.7% |
51.8% |
55.6% |
| Aged care and accommodation |
26.6% |
41.3% |
50.3% |
The Boyne Valley community engaged with Council on the following top 20 customer service requests from 30 June 2021 to 1 July 2022:
| Customer Service Request Type |
Amount |
| Repair / Replacement of Wheelie Bin Request |
9 |
| Development services enquiries |
6 |
| Animal Registration Enquiry / Compliance Matter |
3 |
| Attack / Dangerous / Menacing Dog Incident |
3 |
| Environmental Health Licensing Enquiry |
3 |
| Overgrown / Unsightly Private Property Complaint |
3 |
| Request to change address / details |
3 |
| Debris on Road -tree/object/non toxi liquid/sharps |
2 |
| Drainage,Kerb,Channelling,Pipes,Gully Pits, Drains |
2 |
| Gates and Grids |
2 |
| Other Pest Management Services Requests/Enq. |
2 |
| Statutory Review or Appeal |
2 |
| Administrative Action Complaint (AAC) |
1 |
| Council Street or Park Bins |
1 |
| Gravel Road Repair (corrugations/stones/ruts/dust) |
1 |
| Leak on Footpath / Road |
1 |
| Missed Wheelie Bin / Collection Problem |
1 |
| New Initial / Additional Kerbside Collection Levy |
1 |
| Overgrown Council Land Requiring Mowing |
1 |
| Parks Projects Enquiries and Requests |
1 |
| Public Waste Services Miscellaneous Request |
1 |
| Rates matters |
1 |
| Sealed Road Repair (bitumen,potholes,defects) |
1 |
| Tree Request and Enquiries on Council Land |
1 |
| Waste Infirm Services |
1 |
| Water Meter Enquiry/Issues/Reading |
1 |
| Wild/Pest Animal & 1080 (Dingo/Rabbit/Deer/Pig) |
1 |
Rating Arrears
The Boyne Valley socio-economic position is in lower than the Gladstone Region.The median weekly household income for Boyne Valley is $1,468 compared to $1,693 for the Gladstone Region. The Boyne Valley has 261 rateable residential properties and 86 commercial properties.
Residential properties in arrears increased by 55% from June (13 properties) to October 2022 (29 properties).
Seven commercial properties were in arrears as at 30 October 2022.
The total rateable residential properties in Gladstone is 13,008. On average, 15.4 per cent of households have outstanding rate payments.
Education
Buliyan State School
Early Childhood – Year 6
Co-Educational
9 Students (2021)
Nagoorin State School
Early Childhood – Year 6
Co-Educational
24 Students
Ubobo State School
Early Childhood-Year 6
Co-Educational
Two Students (2019)
Community Facilities
Boyne Valley Community Discovery Centre Inc
Centre is available for camping and overnight accommodation. It is also available for hire welcoming social, sporting, education and recreational groups, families, and individuals to enjoy a bush getaway on 3.21ha of open space. Facilities are clean and well maintained. All buildings have disability access with cement paths for ease of movement
Community Groups
- Boyne Valley Cottage Craft Group
- Boyne Valley CWQ / Strong communities
- Boyne Valley Historical Society Inc
- Boyne Valley Lions Club
- Bulliyan Many Peakes Community Development Assoc
- Cedar Vale Rural Fire Brigade
- Diglum Rural Fire Brigade
- Friends of Boyne Valley Inc
- Many Peaks Rural Fire Brigade
- Nagoorin Progress Association/Boyne Valley Historical Society
- QCWA Boyne Valley
- The Community Shed Boyne Valley Inc
- Ubobo Progress Assoc
Sporting Groups
- Boyne Valley Canoe Assoc Inc
- Ubobo Canoe Assoc
Community-led Events
- Boyne Valley Country Music Campout
- The Garden Market Boyne Valley
Parks
- Dawes National Park
- Dawes Resource Reserve
- Wietalaba National Park
Sport & Recreation