Gladstone City is full of unexpected surprises. It is the state’s engine room; an industrial powerhouse of global significance that is well and truly at the forefront of the resources industry
This dynamic city offers a range of entertainment including the Gladstone Regional Art Gallery & Museum and Gladstone Entertainment Convention Centre, a wide variety of restaurants and bars and local history with countless colonial buildings.
At the heart of Gladstone’s city centre is an impressive natural deep-water harbour. Each year this harbour plays host to the annual Brisbane to Gladstone Yacht Race, marked by the Gladstone Harbour Festival.
Medians compared to Gladstone Region and Queensland:
- A median age of 35 which is lower than the region and State.
- Gladstone has a notably higher cultural diversity than the Gladstone Region but lower than the State.
- Higher proportion of couples with children than the region but lower than the State.
- Households have a weekly income that is in line with the region and State and has reduced over time.
- Gladstone has a slightly lower number of households with a mortgage than the region and is in line with the State.
- The number of people attending university is higher than the region but almost half the rate in the State. The percentage of the population attending university has stayed static between 2016 and 2021.
| Data focus |
Gladstone |
Gladstone Region |
Queensland |
|
2021 |
2016 |
2011 |
Change 2021- 2011 |
Change 2021- 2016 |
Change 2016- 2011 |
2021 |
2021 |
| Median Age |
35 |
36 |
35 |
4 |
3 |
32 |
38 |
38 |
| Non English Speaking Backgrounds |
9.5% |
9.4% |
3.8% |
5.70% |
0.1% |
5.6% |
5% |
12.6% |
| Couple Family With Children |
41.8% |
45.5% |
47.6% |
-5.8% |
-3.7% |
-2.1% |
41.7% |
55.4% |
| Couple Family without children |
36.8% |
37.1% |
36.3% |
0.5% |
-0.3% |
0.8% |
40.5% |
28% |
| Average number of people per household |
2.5 |
2.5 |
2.7 |
-0.2 |
0 |
-0.2 |
2.5 |
2.5 |
| Household with a mortgage |
34.2% |
35.1% |
38.5% |
-4.3% |
-0.9% |
-3.4% |
37% |
34.4% |
| Households renting |
39.5% |
40.4% |
32.4% |
7.1% |
-0.9% |
8.0% |
33.4% |
33% |
| Median weekly household income |
$1,622 |
$1,608 |
$1,792 |
-$170 |
$14 |
-$184 |
$1,639 |
$1,675 |
| Median monthly mortgage repayments |
$1,517 |
$1,950 |
$2,000 |
-$483 |
-$433 |
-$50 |
$1,600 |
$1,733 |
| Median weekly rent (overall) |
$265 |
$240 |
$300 |
-$35 |
$25 |
-$60 |
$275 |
$365 |
| University attendance |
8.1% |
8.1% |
1.9% |
6.2% |
0.0% |
6.2% |
7.2% |
14.2% |
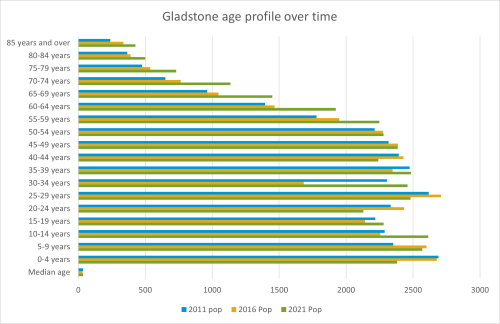
In 2021 the community of Gladstone had a population of 37,703 which is an increase of 5,630 since 2011. With the largest increase taking place between 2016 and 2021, at 4,285 people. It is estimated that the population will increase by a further 3,090 to 12,991 people by 2041, with the retirement age (65-79) cohort forecast to experience the largest increase.
In 2021 the median age for Gladstone was 35, which is lower than the region and State median age of 38.
 Since 2011 the median age of Gladstone has fluctuated from 35 in 2011 to 33 in 2016 and back to 35 in 2021.
The Gladstone community is diverse across age groups, with people living in the area until their senior years.
There are some strong trends and a notable decrease in the community aged between 0-4 years old and through to 50-54 years old between 2021, 2016 and 2011.
The most notable decrease is for those aged 35-44 years old, with a decrease of 266 people between 2011 and 2021.
There are notable increases across all age brackets from 55-79 years old, with an increase of 963 people.
In 2021 the age groups that differ most to the Gladstone Region are:
- Gladstone has a larger proportion of the population aged 25-29 making up 6.6 per cent of the population (2,481 people) compared to 5.9 per cent for the region. The proportion of people in this age bracket has decreased by 1.6 per cent between 2016 and 2021.
- Gladstone has a larger proportion of the population aged 20-24 making up 5.65 per cent of the population (2,129 people) compared to 5 per cent for the region. Although, the proportion of people in this age bracket has decreased by 1.6 per cent over the past five years.
- Gladstone has a smaller proportion of the population aged between 50 and 84 than the region, however at a local level the percentage of people in these age brackets are increasing with an increase of 2,427 people between 2011 and 2021.
There will continue to be demand for diverse services and activity opportunities to cater for all age groups in the community.
Consideration should be given to services, lifestyle offerings and opportunities for those in tertiary education and the young work force if they are to stay within the region. Currently, Gladstone’s population is decreasing at a higher proportional rate than the wider region. This could impact on the number of parents, home builders and ultimately the region’s future growth.
With a significant ageing population and with the trend of retirement living, consideration should be made for increased access to health services.
| Age |
|
Gladstone |
|
Gladstone Region |
Queensland |
|
2021 Pop |
% pop |
2016 Pop |
% pop |
2011 pop |
% pop |
% Change 2011- 2021 |
% Change 2016- 2021 |
% Change 2011- 2016 |
2021 Pop |
% pop |
2021 Pop |
% pop |
| Median age |
35 |
N/A |
33 |
-- |
35 |
NA |
NA |
NA |
|
38 |
N/A |
38 |
N/A |
| 0-4 years |
2381 |
6.32 |
2677 |
8.011 |
2691 |
8.4 |
-2.1 |
-1.7 |
-0.4 |
4,049 |
6.4 |
292,452 |
5.7 |
| 5-9 years |
2569 |
6.81 |
2601 |
7.783 |
2352 |
7.3 |
-0.5 |
-1.0 |
0.4 |
4,686 |
7.4 |
329,311 |
6.4 |
| 10-14 years |
2614 |
6.93 |
2257 |
6.754 |
2288 |
7.1 |
-0.2 |
0.2 |
-0.4 |
4,913 |
7.7 |
342,560 |
6.6 |
| 15-19 years |
2281 |
6.05 |
2141 |
6.407 |
2218 |
6.9 |
-0.9 |
-0.4 |
-0.5 |
4,001 |
6.3 |
313,506 |
6.1 |
| 20-24 years |
2129 |
5.65 |
2433 |
7.281 |
2333 |
7.3 |
-1.6 |
-1.6 |
0.0 |
3,159 |
5 |
323,739 |
6.3 |
| 25-29 years |
2481 |
6.6 |
2709 |
8.1 |
2617 |
8.2 |
-1.6 |
-1.5 |
-0.1 |
3,766 |
5.9 |
347,687 |
6.7 |
| 30-34 years |
2459 |
6.5 |
1684 |
5.0 |
2306 |
7.2 |
-0.7 |
1.5 |
-2.2 |
4,066 |
6.4 |
354,033 |
6.9 |
| 35-39 years |
2485 |
6.6 |
2347 |
7.0 |
2475 |
7.7 |
-1.1 |
-0.4 |
-0.7 |
4,280 |
6.7 |
357,120 |
6.9 |
| 40-44 years |
2240 |
5.9 |
2428 |
7.3 |
2393 |
7.5 |
-1.5 |
-1.3 |
-0.2 |
4,069 |
6.4 |
330,692 |
6.4 |
| 45-49 years |
2385 |
6.3 |
2387 |
7.1 |
2317 |
7.2 |
-0.9 |
-0.8 |
-0.1 |
4,158 |
6.5 |
340,287 |
6.6 |
| 50-54 years |
2280 |
6.0 |
2275 |
6.8 |
2214 |
6.9 |
-0.9 |
-0.8 |
-0.1 |
4,546 |
7.2 |
333,843 |
6.5 |
| 55-59 years |
2249 |
6.0 |
1948 |
5.8 |
1779 |
5.5 |
0.4 |
0.1 |
0.3 |
4,524 |
7.1 |
316,378 |
6.1 |
| 60-64 years |
1923 |
5.1 |
1465 |
4.4 |
1395 |
4.3 |
0.8 |
0.7 |
0.0 |
4,154 |
6.5 |
298,919 |
5.8 |
| 65-69 years |
1449 |
3.8 |
1047 |
3.1 |
963 |
3.0 |
0.8 |
0.7 |
0.1 |
3,190 |
5.0 |
264,515 |
5.1 |
| 70-74 years |
1137 |
3.0 |
764 |
2.3 |
650 |
2.0 |
1.0 |
0.7 |
0.3 |
2,532 |
4.0 |
238,952 |
4.6 |
| 75-79 years |
731 |
1.9 |
537 |
1.6 |
476 |
1.5 |
0.5 |
0.3 |
0.1 |
1,507 |
2.4 |
168,385 |
3.3 |
| 80-84 years |
500 |
1.3 |
390 |
1.2 |
365 |
1.1 |
0.2 |
0.2 |
0.0 |
886 |
1.4 |
106,611 |
2.1 |
| 85 years and over |
427 |
1.1 |
337 |
1.0 |
238 |
0.7 |
0.4 |
0.1 |
0.3 |
677 |
1.1 |
98,135 |
1.9 |
| Group |
Age |
Gladstone |
Gladstone Region |
|
|
2021 |
% pop |
2016 |
% pop |
2011 |
% pop |
% Change 2011- 2021 |
% Change 2016- 2021 |
% Change 2011- 2016 |
2021 |
% pop |
| Babies and pre-schoolers |
0-4 yrs |
2381 |
6.3 |
2677 |
8.0 |
2691 |
8.4 |
-2.1 |
-1.7 |
-0.4 |
4,049 |
6.4% |
| Primary and secondary schoolers |
5-19 yrs |
7464 |
19.8 |
6,999 |
20.9 |
6,858 |
21.4 |
-1.6 |
-1.1 |
-0.4 |
13,600 |
28.8% |
| Tertiary education and independence |
20-24 yrs |
2129 |
5.6 |
2433 |
7.3 |
2333 |
7.3 |
-1.6 |
-1.6 |
0.0 |
3,159 |
5.0% |
| Young workforce |
25-29 yrs |
2481 |
6.6 |
2709 |
8.1 |
2617 |
8.2 |
-1.6 |
-1.5 |
-0.1 |
3,766 |
5.9% |
| Parents and home builders |
30-49yrs |
9569 |
25.4 |
8,846 |
26.5 |
9,491 |
29.6 |
-4.2 |
-1.1 |
-3.1 |
16,933 |
26.6% |
| Older workers and retirees |
50-59 yrs. |
4529 |
12.0 |
4,223 |
12.6 |
3,993 |
12.4 |
-0.4 |
-0.6 |
0.2 |
9,070 |
14.3% |
| Empty nesters and retirees |
60-69 yrs |
3372 |
8.9 |
2512 |
7.5 |
2358 |
7.4 |
1.6 |
1.4 |
0.2 |
7,344 |
13.6% |
| Seniors |
70-84 yrs |
2368 |
6.3 |
1691 |
5.1 |
1491 |
4.6 |
1.6 |
1.2 |
0.4 |
4,925 |
7.8% |
| Elderly aged |
85+ |
427 |
1.1 |
337 |
1.0 |
238 |
0.7 |
0.4 |
0.1 |
0.3 |
679 |
1.1% |
Service group breakdown compared to the Region, source ABS 2022, 2016, 2011
Gladstone has diverse household types with the main groups being couples with children and couples without children.
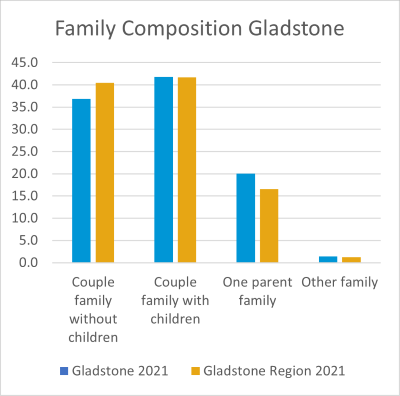 The percentage of couple families with children in Gladstone is 41.8 per cent of the population in line with the region at 41.7 per cent and slightly higher than the State 41.2 per cent.
One parent families represent 20 per cent of the community, an increase of 5.4 per cent (597 families) since 2011, this is also higher than the region by 3.4 per cent when looking at a population level. This figure is also more than double the State at 9.1 per cent.
People in a registered marriage make up 42.1 per cent (10,140) of Gladstone in 2021, which is lower compared to the Gladstone Region at 43.6 per cent.
Between 2016 and 2021, the percentage of population in a registered marriage decreased by 4 per cent.
The percentage of people not married has increased by 5.8 per cent between 2016 and 2021, the largest increase taking place between 2016 and 2021 at 4.7 per cent.
People in a De facto marriage increased by 0.3 per cent between 2011 and 2021.
Considerations:
- There is a need to provide a range of programs and services including for couples without children, families with children and individuals.
- When planning and programming events, activities and services consideration needs to be given to accessibility given increasing number of single parent families.
Family composition
|
Gladstone |
|
|
|
Gladstone Region |
Queensland |
|
2021 |
% pop |
2016 |
% pop |
2011 |
% pop |
% Change 2011- 2021 |
% Change 2016- 2021 |
% Change 2011- 2016 |
2021 pop |
% pop |
2021 pop |
% pop |
| Couple family without children |
3,323 |
36.8 |
3205 |
37.1 |
3004 |
36.3 |
0.5 |
-0.3 |
0.8 |
6829 |
40.5 |
551069.0 |
40.3 |
| Couple family with children |
3,771 |
41.8 |
3,898 |
45.2 |
3,937 |
47.6 |
-5.8 |
-3.4 |
-2.4 |
7021 |
41.7 |
563327.0 |
41.2 |
| One parent family |
1807 |
20.0 |
1404 |
16.3 |
1210 |
14.6 |
5.4 |
3.7 |
1.6 |
2798 |
16.6 |
124174.0 |
9.1 |
| Other family |
130 |
1.4 |
121 |
1.4 |
124 |
1.5 |
-0.1 |
0.0 |
-0.1 |
202 |
1.2 |
46707.0 |
3.4 |
Social Marital Status
| Gladstone |
Gladstone Region |
|
2021 |
% pop |
2016 |
% pop |
2011 |
% pop |
% Change 2011- 2021 |
% Change 2016- 2021 |
% Change 2011- 2016 |
2021 pop |
% pop |
| Registered marriage |
10,140 |
42.1 |
10,206 |
46.0 |
10,371 |
48.2 |
-6.1 |
-4.0 |
-2.1 |
20253 |
43.6% |
| De facto marriage |
3,559 |
14.8 |
3,431 |
15.5 |
3,121 |
14.5 |
0.3 |
-0.7 |
1.0 |
6476 |
14.8% |
| Not married |
10,412 |
43.2 |
8,540 |
38.5 |
8,045 |
37.4 |
5.8 |
4.7 |
1.2 |
16998 |
38.9% |
source ABS 2022, 2016, 2011
 In 2021, 79 per cent of the Gladstone population was born in Australia, compared to 79.6 per cent in the Gladstone Region.
A further 4.1 per cent were born overseas from other English-speaking countries including, Canada, England, Ireland New Zealand, South Africa, Scotland and United States of America.
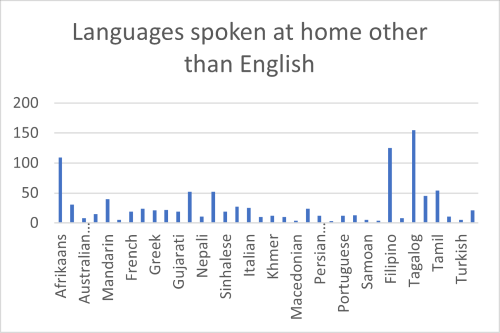
In Gladstone 9.5 per cent of the community were born in 37 different non-English speaking countries. Which is an increase of 3.8 per cent when compared to 2011 and 9.4 per cent in 2016.
 The community of Boyne Tannum includes 2,478 Aboriginal and Torres Strait Islander people, which is 7.1 per cent of the population. There has been a sizable increase in the number of people in Aboriginal and Torres Strait Island people in Gladstone. Representing 4.6 per cent (1,548 people) of the population in 2016 and 4.1 per cent (1,338) of the population 2021, an increase of 1,140 people over 10 years.
English is the main language spoken at home for 86 per cent of the community in Gladstone compared to 87.1 per cent in the Gladstone Region.5.9 per cent of households in the Gladstone speak another language other than English at home, with 37 languages spoken.
The main religious followings in the Gladstone community are:
- 45.7% - No religion
- 17.4% - Catholic
- 11.2% - Anglican
- 3.1% - Uniting Church
- 2.5% - Presbyterian and Reformed
- 2.3% - Christianity, nfd
- 1.8% - Baptist
- 1.4% - Pentecostal
- 1.2% - Hinduism
- 0.9% - Buddhism
In addition to 45.7 per cent of the community stating they had no religion, a further 8.1 per cent did not respond.
This equates to 18,650 community members either with no religion or unknown and 14,754 who reported religious affiliation.
There has been an increase of 22.2 per cent of community members stating they had no religion between 2011 and 2021.
The main occupation categories for people aged 15 years and over in Gladstone are:
- 25.0% - Technicians and Trade Operators
- 21.5% - Professionals
- 11.8% - Community and personal service workers
- 9.6% - Clerical and Administrative Workers
- 9.1% - Machinery Operators
- 8.7% - Managers
 The community of Gladstone has seen a significant change in its population between 2011 and 2021, with a decrease of around 5,500 community members.
There have been changes across all occupational categories, some categories have seen an increase a percentage of the workforce while seeing a decrease in the number of people in the category.
Between 2011 and 2016 there was a decrease in the number of people working across all occupational categories with the exception of labourers which increased from 343 people or 2.1 per cent of the workforce to 718 people or 7.6 per cent of the workforce in 2016. The number of people in this category increased again slightly to 759 people or 7.2 of the workforce in 2021.
The percentage of the workforce that are professionals has increased from 13.9 per cent (2,224 people) of the workforce in 2011 to 21.2 per cent (2,690 people) of the workforce in 2016 and 21.5 per cent in 2021 or 2,281 people.
There is also a shift in the proportion of the workforce in the community and personal service category, making up 11.8 per cent (1,249 people) of the workforce in 2021, 10.1 per cent (960 people) of the workforce in 2016 and 7 per cent or 1,128 people in 2011.
There has been a reduction in the percentage of the workforce that work as a machinery operator. Although decreasing by 3.6 per cent between 2021 and 2011 there was an in fact an increase in the number more people working in this category between 2011 and 2021, increasing by 200 people.
The percentage of population working in sales decreased by 4.2 per cent between 2011 and 2016 and 0.6 per cent in 2021, during this year there were 536 sales workers.
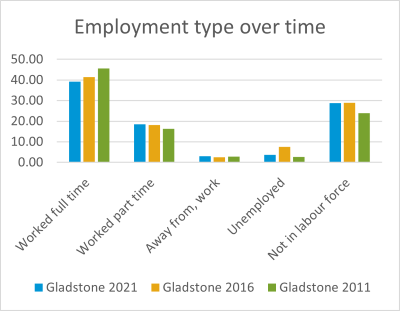
 Between 2011 and 2012 there was an 8.7 per cent decrease in the percentage of the population that work full time, with the largest decrease of 7.2 per cent taking place between 2011 and 2016.
There has been a steady increase in the percentage of the population working part time, in 2011 it was 14.7 per cent of the workforce (3,626 people), in 2016 it was 16.3 per cent (4,222 people) and in 2021 it was 17.6 per cent or 4,780 people.
The percentage of the Gladstone population that has been unemployed between 2021 and 2011 has fluctuated. With 0.9 per cent of the population (231 people) unemployed in 2011, 7.6 per cent (1,974 people) in 2016 and 5.2 per cent or 1,421 people in 2021. Overall, there was an increase in the percentage of population unemployed between 2021 and 2011 of 4.03 per cent.
There has been a steady increase in the percentage of people not in the Labour force, increasing from 24 per cent in 2011 to, 26.8 per cent in 2016 and 29.5 per cent in 2021.
 The top five industries of employment have remained relatively static across 2021, 2016 and 2011.
In 2021 the top five industries of employment were, Manufacturing, Health care and social assistance, Retail Trade, Construction and finally Transport, Postal and Warehousing.
In 2016 the top five industries of employment were, Manufacturing and in joint second were construction and Retail Trade followed by Transport, Postal and Warehousing, then Health care and social assistance and finally Education and Training.
In 2011 the top five industries of employment were, Manufacturing, Construction, Retail Trade, Transport, Postal and Warehousing and Professional, Scientific and Technical Services.
The industries with the largest increases are Health Care and Social Assistance, increasing by 4.2 per cent (665 people) since 2011 and Education and Training which has increased by 1.6 per cent or 244 people since 2011.
In 2011, 8 per cent of people worked in Professional, Scientific and Technical Services, reducing to 3.3 per cent in 2021. A reduction of 754 people.
 The second highest decrease was seen in the construction industrial category, with a 3.1 per cent reduction in the population working in this category since 2011. It is worth noting that the majority of this reduction 2.6 per cent took place between 2011 and 2016.
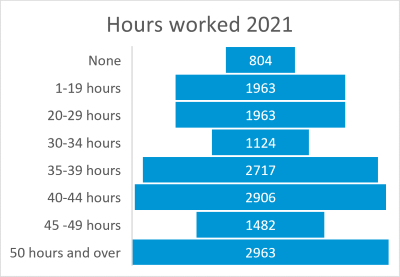
Hours worked can only be shown for 2016 and 2021 due this data not being captured in the 2011 Census.
There has been a 3 percent decrease in the number of employees working 35 hours or more between 2011 and 2016, being 63% and 66% respectively.
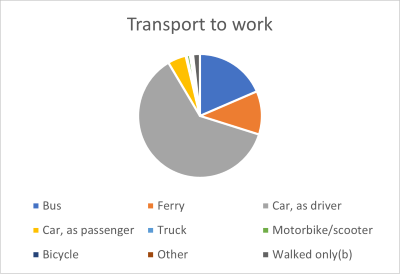
Data from the 2021 Census shows 93 per cent of workers travel to their place of work by car, either as driver or passenger.
| Industry |
2021 Pop |
% pop |
2016 Pop |
% pop |
2011 pop |
% pop |
% Change 2011- 2021 |
% Change 2016- 2021 |
% Change 2011- 2016 |
| Agriculture, Forestry and Fishing |
49 |
0.3 |
47 |
0.3 |
41 |
0.3 |
0.1 |
0.0 |
0.1 |
| Mining |
480 |
3.0 |
546 |
3.6 |
515 |
3.2 |
-0.2 |
-0.6 |
0.4 |
| Manufacturing |
2,210 |
13.9 |
2,024 |
13.5 |
2,632 |
16.4 |
-2.6 |
0.4 |
-3.0 |
| Electricity, Gas, Water and Waste Services |
492 |
3.1 |
442 |
2.9 |
443 |
2.8 |
0.3 |
0.1 |
0.2 |
| Construction |
1,586 |
10.0 |
1,569 |
10.4 |
2,086 |
13.0 |
-3.1 |
0.5 |
-2.6 |
| Wholesale Trade |
272 |
1.7 |
321 |
2.1 |
402 |
2.5 |
-0.4 |
-0.4 |
-0.4 |
| Retail Trade |
1,619 |
10.2 |
1,565 |
10.4 |
1,630 |
10.2 |
0.0 |
-0.2 |
0.2 |
| Accommodation and Food Services |
1,123 |
7.1 |
1,015 |
6.8 |
915 |
5.7 |
1.3 |
0.3 |
1.0 |
| Transport, Postal and Warehousing |
1,346 |
8.5 |
1,335 |
8.9 |
1,333 |
8.3 |
0.1 |
-0.4 |
0.6 |
| Information Media and Telecommunications |
64 |
0.4 |
73 |
0.5 |
69 |
0.4 |
0.0 |
-0.1 |
0.1 |
| Financial and Insurance Services |
124 |
0.8 |
152 |
1.0 |
205 |
1.3 |
-0.5 |
-0.2 |
-0.3 |
| Rental, Hiring and Real Estate Services |
238 |
1.5 |
254 |
1.7 |
273 |
1.7 |
-0.2 |
-0.2 |
0.0 |
| Professional, Scientific and Technical Services |
529 |
3.3 |
869 |
5.8 |
1,283 |
8.0 |
-4.7 |
-2.5 |
-2.2 |
| Administrative and Support Services |
568 |
3.6 |
453 |
3.0 |
422 |
2.6 |
0.9 |
0.6 |
0.4 |
| Public Administration and Safety |
770 |
4.8 |
661 |
4.4 |
621 |
3.9 |
1.0 |
0.4 |
0.5 |
| Education and Training |
1,271 |
8.0 |
1,172 |
7.8 |
1,027 |
6.4 |
1.6 |
0.2 |
1.4 |
| Health Care and Social Assistance |
1,716 |
10.8 |
1,239 |
8.2 |
1,051 |
6.6 |
4.2 |
2.5 |
1.7 |
| Arts and Recreation Services |
95 |
0.0 |
101 |
0.7 |
77 |
0.5 |
-0.5 |
-0.7 |
0.2 |
| Other Services |
650 |
0.9 |
569 |
3.8 |
577 |
3.6 |
-2.7 |
-2.9 |
0.2 |
| Inadequately described/Not stated |
731 |
4.6 |
616 |
4.1 |
418 |
2.6 |
2.0 |
0.5 |
1.5 |
The Gladstone community is in line with the socio-economic profile of the Gladstone Region.
- The median weekly household income is $1,622 compared to $1,693 for the Gladstone Region.
- 25.2 per cent of households earn $3,000 or more per week compared to 25.3 per cent for the Gladstone Region.
- 6.9 per cent households earn less than $650 each week compared to 7.2 per cent for Gladstone Region, which is a decrease of 8 per cent compared to 2016.
- 37.7 per cent of non-family households earn less than $650 each week compared to 47.0 per cent for Gladstone Region. There has been a 6.5 per cent increase in non-family households earning less than $650 between 2021 and 2016.
In 2021, 58.7 per cent of people aged 15 and over are in the labour force, which is slightly higher than 2016 data at 58.1 per cent and lower the 64.8 per cent in 2011.
The unemployment rate for the Gladstone community has fluctuated over time, being 5.2 per cent (1,421 people) in 2021, 7.6 per cent (1,974 people) in 2016 and 0.9 per cent (231 people) in 2011.
The SEIFA score for Gladstone Region in 2016 was 978.Across Australia’s local government areas, SEIFA scores range from 188 (most disadvantaged) to 1,186 (least disadvantaged).
 In 2021, 22 per cent of households fully owned their housing which is 5 per cent lower than the Gladstone Region at 27.3 per cent. There have been fluctuations with the percentage of population that own their home outright and the number that own them.
In 2011, 22.7 per cent of the population owned their home outright which equated to 2,451 people. This decreased by 2.9 per cent of the population in 2016, with 2,350 people owing their home outright. Before increasing in 2021 to 22 per cent of the population or 2,880 people.
The population of Gladstone that own their home with a mortgage is decreasing, being 38.5 per cent of the population in 2011, 35.1 per cent in 2016 and 34.2 per cent in 2021. Meaning the percentage of population with a mortgage is 2.3 per cent less than the region.
The population of Gladstone that rents their home has fluctuated a little, being 32. per cent of the population in 2011 or 3,495 people, 40.3 per cent in 2016 which equates to 4,811 people and 39.5 per cent of the population in 2021 or 5,175, which is a 7.2 per cent increase in population from 2011.
The percentage of those renting from a real estate has increased by 9.2 per cent between 2011 and 2021, with the largest increase of 9.1 per cent between 2011 and 2016.
When looking at those renting from State or Territory housing providers, the numbers have steadily decreased between 2011 and 2021, with 972 people renting from State or Territory housing providers in 2011, representing 6.2 per cent of the population. In the 2016 the figure was 612 people or 5.1 per cent of the population. The numbers reduced further in 2021, with a reduction of 112 people compared to 2016. Meaning 500 people or 3.8 per cent of the population rented their home from a State or Territory housing provider.
Community members that stated they rented from a Community Housing Provider increased over time, being 32 in 2011, 105 in 2016 and 159 in 2021.
The average mortgage repayment is $1,517 which is lower than the Gladstone Region by $112 and lower than the State by $216. There has been a $483 reduction in average mortgage payments between 2011 and 2021, with the largest reduction being $433 between 2016 and 2023.
There is a general increase of households paying between $0-$1799 between 2011 and 2021. The most significant change is a 7.2 per cent (362 people) increase in the population paying $1,000-$1,399, followed by a 6.4 per cent increase in the population paying $1,400-$1,799, which equates to 332 people.
There is a general trend in the number of people paying monthly mortgage payments between $1,800 and $4,000 reducing over the last 10 years, with some significant reductions between 2016 and 2021. The largest reductions were seen in the number of people paying $2,400-$2,999, reducing by 337 people to 6.7 per cent of the population compared to 15.3 per cent in 2011.
There was also a notable difference in the population paying $1,800-$2,399, with a 1.6 per cent increase between 2011 and 2016 and a 6.9 per cent decrease between 2016 and 2021. This equates to an overall decrease of 5.3 per cent of the population or 154 people.
The median rent for Gladstone was $265 in 2021 compared to $275 in the Gladstone Region and $365 in the State. The median rent in Gladstone has fluctuated over time being, $265 in 2021, $240 in 2016 and $300 in 2011.
| Rent |
2021 |
% |
2016 |
% |
% Change 2016- 2021 |
| $1-$74 |
101 |
1.9 |
162 |
3.2 |
-1.3 |
| $75-$99 |
71 |
1.3 |
102 |
2.0 |
-0.7 |
| $100-$149 |
382 |
7.0 |
439 |
8.6 |
-1.6 |
| $150-$199 |
753 |
13.8 |
798 |
15.6 |
-1.8 |
| $200-$224 |
581 |
10.7 |
720 |
14.1 |
-3.4 |
| $225-$274 |
910 |
16.7 |
1,198 |
23.5 |
-6.8 |
| $275-$349 |
1,397 |
25.6 |
994 |
19.5 |
6.2 |
| $350-$449 |
912 |
16.7 |
391 |
7.7 |
9.1 |
| $450-$549 |
122 |
2.2 |
94 |
1.8 |
0.4 |
| $550-$649 |
25 |
0.5 |
21 |
0.4 |
0.0 |
| $650-$749 |
14 |
0.3 |
7 |
0.1 |
0.1 |
| $750-$849 |
0 |
0.0 |
4 |
0.1 |
-0.1 |
| $850-$949 |
0 |
0.0 |
0 |
0.0 |
0.0 |
| $950 and over |
6 |
0.1 |
4 |
0.1 |
0.0 |
| Rent not stated |
184 |
3.4 |
168 |
3.3 |
0.1 |
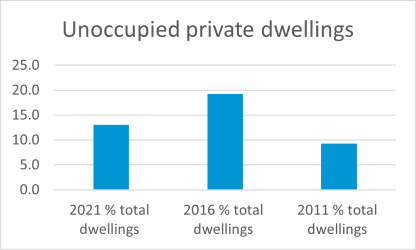
86.9 per cent dwellings are occupied in Gladstone, compared with 85 per cent in the Gladstone Region.
 Most of the housing in Gladstone is seperate houses at 71.2 per cent. There has been an increase in the number off flats and apartments which has increased from 963 in 2011 to 1,056 in 2016 and 1,266 in 2021. This means 8.4 per cent of the Gladstone population live in flats or apartments, which is 2.4 per cent higher that the region.
The number of semi-detached, row or terrace house, townhouses has doubled between 2011 and 2021, increasing from 456 in 2011 to 879 in 2016 and 1033 in 2021. These types of homes are lived in by 6.9 per cent of the Gladstone community, an increase of 3 per cent compared to 2011.
Considerations:
- Gladstone has a growing number of people living in higher density housing, which can create greater demand for open space, indoor recreation facilities, public places, entertainment opportunities and green infrastructure including appealing streetscapes.
| Occupancy |
|
2021 % total dwellings |
2016 % total dwellings |
2011 % total dwellings |
| Total Occupied dwellings |
86.9 |
80.8 |
90.7 |
| Unoccupied private dwellings |
13.1 |
19.2 |
9.3 |

6.2 per cent of the community requires assistance with core activities, this represents 2,157 people.
The number of people requiring assistance has increased by 1,138 people in the 10-year duration between the 2011 and 2021 Census, increasing by 0.9 per cent between 2011 and 2016 and a further 2.1 per cent between 2016 and 2021.
In addition, the number of people that have 'not stated’ need for assistance has decreased from 8.4 per cent in 2011 to 7.48 per cent in 2016 and 6.5 per cent in 2021.
The largest proportion of people that required assistance with core activities in 2021 was those aged 5-14, make up 15.7 per cent of those that need assistance compared 11.9 per cent in 2011. This means the number of people aged 5-14 that need assistance with core activities has increased by 69.
People in Gladstone aged 55-64 made up 11.1 per cent of the community that needed assistance in 2011 compared to 13.1 per cent in 2021, which equated to 169 people.
Unlike some of the other profiles, seniors and the elderly are not increasing significantly as a proportion of those that need assistance in Gladstone. While there has been an increase 114 people that need assistance aged 75-84 years old between 2011 and 2021. People in this age bracket made up 19.1 per cent of people needing assistance in 2011 and 15 per cent in 2016, reducing further to 14.3 per cent in 2021 which means an overall reduction of 4.8 per cent.
There are 2,851 people providing unpaid assistance to a person with a disability, health condition or due to old age which is an increase of 771 people from 2011. There is a general decrease in the percentage of the population providing support that are aged 15 to 54. Community members aged 55 to 85 years represent a larger proportion on the population provided support in 2021 than in 2011.
Considerations:
- There is an increasing population of school age children needing assistance, consideration to be given when planning programs activities and events.
- Just under 40 per cent of people requiring assistance with core activities are aged between 55 years and over. Consideration should be given when planning for activities designed for seniors.
|
2021 |
% |
2016 |
% |
2011 |
% |
% Change 2011- 2021 |
% Change 2016- 2021 |
% Change 2011- 2016 |
| Has need for assistance 2021 |
2157 |
6.2 |
1,369 |
4.1 |
1019 |
3.2 |
3.0 |
2.1 |
0.9 |
| Does not have need for assistance 2021 |
30,274 |
87.2 |
29,431 |
88.1 |
28351 |
88.4 |
-1.2 |
-0.8 |
-0.3 |
| Need for assistance not stated 2021 |
2269 |
6.5 |
2617 |
7.8 |
2703 |
8.4 |
-1.9 |
-1.3 |
-0.6 |
Volunteering could be stronger in the Gladstone Community with 4,040 (10.8 per cent) people aged 15 years and over providing volunteer services. This compares to 16.2 per cent for the Gladstone Region.
The number of volunteers in Gladstone has fluctuated over time with 4,561 volunteers in 2011, which increased by 277 in 2016 with 4,838 people volunteering. The number of volunteers dropped significantly between 2016 and 2021, with 798 less volunteers. This means Gladstone has had a net loss in volunteers of 521 between 2011 and 2021.
There have been changes in the percentage of population volunteering across all age brackets, with decreases across four and increases across five.
The percentage of volunteers that are aged 15-19 years has increased by 0.4 per cent since 2011. While the percentage of volunteers that are aged 20-54 has decreased by 9.1 per cent while the proportion of volunteers that are aged 55 to 84 years old has increased by 7.9 per cent
With a population of just shy of 38,000, the Gladstone community has a large number of community groups, sport and recreation groups and support services.
Considerations:
- Volunteer numbers are dropping and those that do volunteer are ageing. If is a reduction in younger volunteers over the long term could have an impact on sustainability and viability of community groups, events and sport and recreation organisations.
Council regularly undertakes a Community Satisfaction Survey to identify community sentiment with respect to its assets, services and programs.
|
Gladstone Region |
LGA Benchmark |
| Overall satisfaction |
56.0% |
55.7% |
|
|
|
| ASSETS |
|
|
| (1 = very dissatisfied – 5 = very satisfied) |
|
|
| Landfills and waste management facilities |
66.2% |
70.2% |
| Art Galleries and museums |
65.9% |
70.7% |
| Public toilets and amenities |
61.4% |
67.7% |
| Libraries |
74.6% |
78.0% |
| Airports and aerodromes |
70.8% |
70.1% |
| Parking facilities and street parking |
57.5% |
65.7% |
| Performing arts centres |
69.1% |
69.0% |
| Lighting and signage |
60.4% |
68.9% |
| Beaches and coastal areas |
66.4% |
73.7% |
| Landscapes and streetscapes |
69.5% |
70.1% |
| Halls and community centres |
63.4% |
72.2% |
| Stormwater and flood control system |
57.3% |
67.1% |
| Water and sewerage system |
61.8% |
71.5% |
| Boat ramps and jetties |
61.0% |
71.0% |
| Parks and open space |
65.4% |
75.0% |
| Footpaths and cycleways |
56.8% |
68.1% |
| Local roads and bridges |
53.8% |
65.8% |
| Sport and recreation facilities |
61.3% |
73.2% |
| Camping grounds and caravan parks |
55.8% |
68.9% |
| Swimming pools and aquatic centres |
52.5% |
71.5% |
|
|
|
| SERVICES |
|
|
| (1 = very dissatisfied – 5 = very satisfied) |
|
|
| Emergency and disaster management |
63.8% |
71.0% |
| Waste services |
68.1% |
74.0% |
| Customer service |
61.6% |
69.7% |
| Consulting with the community |
49.7% |
61.1% |
| Building services |
62.8% |
64.8% |
| Animal management services |
54.5% |
66.1% |
| Informing the community of council decisions |
52.1% |
64.4% |
| Financial management |
47.8% |
61.1% |
| Environmental management |
53.6% |
66.4% |
| Making and enforcing local laws |
51.2% |
64.9% |
| Advocating on behalf of the community |
59.9% |
64.2% |
| Making decisions in the best interest of the community |
46.6% |
61.5% |
| Community services |
55.5% |
69.8% |
| Planning and development approval |
47.0% |
62.5% |
| Infrastructure and property services |
49.4% |
64.8% |
| Public health services |
54.8% |
71.0% |
| Biosecurity and environmental health |
50.1% |
66.8% |
|
|
|
| INITIATIVES |
|
|
| (1: Far too little – 5: Far too much) |
|
|
| Affordable housing development |
40.7% |
49.7% |
| Community safety and crime prevention |
34.8% |
47.5% |
| Creative arts development |
49.2% |
59.2% |
| Celebration of multiculturalism |
51.1% |
61.5% |
| Festivals and events |
55.9% |
56.8% |
| Celebration of First Nation culture |
53.0% |
63.3% |
| Business development and support |
54.5% |
55.4% |
| Heritage conservation |
42.2% |
55.1% |
| Tourism development and promotion |
45.1% |
57.3% |
| Placemaking to create lively public spaces |
42.9% |
55.9% |
| Opportunities for people of all abilities to participate in community life |
52.3% |
53.9% |
| Grants and support for sports clubs and community organisations |
56.0% |
57.9% |
| Environmental conservation and climate change action |
43.7% |
56.8% |
| Waste minimisation and recycling |
40.3% |
54.4% |
| Children and youth development |
38.3% |
53.6% |
| Childcare |
42.7% |
57.6% |
| Skill development and networking opportunity |
38.6% |
54.5% |
| Health promotion |
52.3% |
55.8% |
| Newcomer attraction and retention |
39.7% |
55.6% |
| Aged care and accommodation |
26.6% |
50.3% |
Customer Service Requests
The Gladstone community engaged with Council on the following top 20 customer service requests from 30 June 2021 to 1 July 2022:
| Customer Service Request Type |
Amount |
| Request to change address / details |
436 |
| Repair / Replacement of Wheelie Bin Request |
281 |
| Leak on Footpath / Road |
259 |
| Development services enquiries |
247 |
| Collection of Found / Privately Impounded Animal |
175 |
| Water Meter Enquiry/Issues/Reading |
167 |
| Animal Noise Nuisance - Includes Caged Birds |
149 |
| Animal Registration Enquiry / Compliance Matter |
148 |
| Hydrant and Other Water Infrastructure Defects |
145 |
| Overgrown / Unsightly Private Property Complaint |
102 |
| Manhole & Other Sewer Infrastructure Defects |
93 |
| Missed Wheelie Bin / Collection Problem |
91 |
| Roaming / Straying Dog or Cat |
86 |
| Tree Request and Enquiries on Council Land |
85 |
| Animal - Cancel Registration |
83 |
| SCADA & Radtel Alarms System |
76 |
| Information Request General |
71 |
| Building & Plumbing Compliance |
70 |
| Statutory Review or Appeal |
68 |
| Obstruction of Footpath -Vehicle / Boat/ Msg Board |
67 |
Rateing Arrears
The Gladstone socio-economic position is in line with the Gladstone Region. The median weekly household income for Gladstone is $1,622 compared to $1,693 for the Gladstone Region.
Residential rate arrears are in mid-range with 2001 properties in arrears as of 30 October 2021 this 0.2 per cent higher than 30 June 2022.The total rateable residential properties in Gladstone is 13,008.On average, 15.4 per cent of households have outstanding rate payments.
On 30 June 2022 9.4 per cent of rateable commercial properties were in arrears, meaning 106 rate payers were in arrears. This increased to 164 rate payers as of 31 October 2022.
Education
Carinty Education Gladstone
Year 7 – Year 12
Co-educational
102 Students (2021)
Central Queensland TAFE
Co-educational
Variety of TAFE courses offered
Chanel College
Year 7 – Year 12
Co-educational
731 Students (2020)
Clinton State School
Prep – Year 6
Co-educational
894 Students (2021)
CQUniversity Australia
Co-educational
Variety of Degrees offered
Faith Baptist Christian School
Prep – Year 12
Co-educational
84 Students (2021)
Gladstone Central State School
Prep – Year 6
Co-educational
337 Students (2021)
Gladstone South State School
Prep – Year 6
Co-educational
368 Students (2021)
Gladstone State High School
Year 7 - Year 12
Co-educational
1519 Students (2021)
Gladstone West State School
Prep – Year 6
Co-educational
606 Students (2021)
Kin Kora State School
Prep – Year 6
Co-educational
742 Students (2021)
Link and Launch Officer
Students who have completed Year 12
Co-educational
Year 13
Rosella Park School
Prep – Year 12
Co-educational
84 Students (2021)
St John The Baptist Catholic Primary School
Prep – Year 6
Co-educational
578 Students (2021)
Star of the Sea Catholic Primary School
Prep – Year 6
Co-educational
310 Students (2021)
Toolooa State High School
Year 7 – Year 12
Co-educational
1065 Students (2021)
Trinity College
Kindergaten – Year 12
Co-educational
552 Students (2021)
Community Facilities
Gladstone Entertainment Convention Centre
56 Goondoon Street
Spacious, modern venue with a varied program of comedy and dance, plus musicals and concerts.
Gladstone Regional Art Gallery & Museum
Cnr of Goondoon and Bramston Street
The Gallery & Museum includes four exhibition spaces known as Town Hall Gallery, Front Gallery, Museum Room and O'Connell Space. Exhibitions of art and history are shown throughout these spaces and are continually transformed every 6 to 8 weeks. The building's four exhibition spaces are on ground level with a workshop studio space accessible downstairs with lift access.
Gladstone Regional Libraries
39 Goondoon Street
The Gladstone Regional Library service has a broad range of services available both in person and online. Facilities also hold:
- Computer access
- Printer
- 3D Printer
Gladstone Tondoon Botanic Gardens
672 Glenlyon Road
Offers a number of facilities including:
- Function Space
- Art Gallery Deck
- Café
- Reference library
- Herbarium
- Garden master site place
PCYC Gladstone
53 Yarroon Street
Offers a range of sporting and recreation facilities, including a spacious gym, as well as youth programs and activities to build Gladstone into a safer and healthier community.
Port Curtis Place – Senior Citizen Centre
83 Oaka Lane
Offer indoor bowls, snooker, card games and hoy. A computer is available for members to use as well as a community services bus.
Childcare
Act For Kids
Act for Kids offer a range of educational services that includes Learn to be Safe with Emmy and Friends, SafeCare and our Early Education Program (EEP).
Birralee Kindergarten
25 Higgins Street
2 different groups running through the week. Group one is Monday – Wednesday 09:00-14:00. Group two is Thursday – Friday 08:30-16:00
C&K Clinton Community Childcare Centre
4 Harvey Road
6 Weeks old – 4 Years old is 6am – 6pm
4 years old – 5 years old is 8am – 4pm
C&K Gladstone Kindergarten
149 Auckland Street
Monday – Friday
8.28am – 2:30pm
C&K Kin Kora Community Kindergarten
84 Sunvalley Road
Monday, Tuesday, alternating Wednesday
Clinton State School Special Education Program
0-5 Years, Free
Community Kids Clinton Park Early Education Centre
18 Ballintine Street
6am – 6pm
Children aged 6 Weeks – 6 Years
Enhance Family Day Care and In Home Care Gladstone
134 Aukland Street
8.30am – 4:30pm
Good Start Gladstone – Beak Street
1 Beak Street
Nursery – Kindergarten
Good Start Gladstone – Toolooa Street
123 Toolooa Street
Nursery – Kindergarten
Green Leaves Early Learning Centre
3 Starling Drive
6.30am – 6.30pm
6 weeks – 6 years
Kookaburra Creek Kindergarten
28 Anderson Street
8.30am – 2.30pm
Koolyangarra Kindergarten
29 Boyne Cresent
Preschool Age
Port City Kids
27 Garden Street
0-5 Year old
Before school and after school care available
Rainbow Valley Early Learning Centre
12 Uniting Plough
6.15am-6.15pm
0 – 5 Years old
St Stephens Child Care Centre
1 Bellevue Park Road
18 Months – 6 Years
8.00-4.00pm
Trinity College Kindergarten
4 Archer Street
Kindergarten program
8.00-3.30pm
Stepping Stones Child Care Centre
26 Bramston Street
6.45am-6.15pm
Monday – Friday
Community Groups
- 18 Degree Rose Cois Chapter No 206
- 1st Gladstone Boys Brigade
- 2nd Gladstone Girls Brigade
- Adopt-a-Grandparent Gladstone
- Agapi Enterprises (Gladstone) Inc
- Anglican Parish of Gladstone
- Aspergers Autism Support Group
- Australian Navy Cadets – T.S. Gladstone
- Baha’I Community of Gladstone Region
- Bridge Club
- BYG House – Gladstone Baptist Youth Group
- Capricorn Helicopter Rescue Service Ltd
- Catholic Church
- Central Queensland Indigenous Development
- Communities for Children (GAPDL)
- Conservation Volunteers Australia
- Coordinated Community Response to Domestic and Family Violence (CCRDFV)
- Creative Gladstone Region
- Crow Street Creative Inc
- Curtis Coast Arts Alliance Inc
- Curtis Island Rural Fire Brigade
- Dancing 60/40
- Dirty Rascals Playgroup
- Dolphin Sea Scout Group
- Embroiderers’ Guild Qld Inc. (The) Gladstone Branch
- Evenglow
- Facing Island Rural Fire Brigade
- Faith Baptist Church
- Friends in Art
- Friends of Bonsai
- Friends of Fiji
- Gideons International
- Gladstone & District Wildlife Carers Association Inc
- Gladstone Aboriginal and Islander Cooperative Society Ltd
- Gladstone Amateur Radio Club Inc
- Gladstone and District Philatelic Society Inc
- Gladstone Area Potters Group Inc
- Gladstone Area Promotion and Development Limited (GAPDL)
- Gladstone Area Writers Group
- Gladstone Baptist Church
- Gladstone Baptist Craft Group
- Gladstone Branch Australian Native Bee Association (ANBA)
- Gladstone Cake Decorators Club
- Gladstone Camera Club
- Gladstone Central Church of Jesus Christ
- Gladstone Chamber of Commerce and Industry Inc
- Gladstone Chess Club Inc
- Gladstone Church of Christ
- Gladstone Country Music Group
- Gladstone Dance Festival Association
- Gladstone Dementia Carers Social Group
- Gladstone Diabetes Association
- Gladstone District Bushwalkers
- Gladstone District Gem and Mineral Club
- Gladstone District Model Railway Group
- Gladstone Dog Obedience Club
- Gladstone Engineering Alliance Inc
- Gladstone Fine Art Group
- Gladstone Food Centre
- Gladstone Girl Guides
- Gladstone Gospel Chapel
- Gladstone Group of Gamblers Anonymous
- Gladstone Kennel Club Inc
- Gladstone LAN Group
- Gladstone Local Marine Advisory Group
- Gladstone Maritime Museum
- Gladstone Masonic Lodge No.205 UGLQ
- Gladstone Mens Shed Association Inc
- Gladstone Model Aero Club
- Gladstone Multicultural Association
- Gladstone Multicultural Playgroup
- Gladstone Municipal Band
- Gladstone Musical Society Inc
- Gladstone Orchid & Foliage Society Inc
- Gladstone Parkinsons Support Group
- Gladstone PAWS Irish Dancers
- Gladstone Pensioners & Superannuants League
- Gladstone Performing Art Company
- Gladstone Presbyterian Church
- Gladstone RSL Sub-Branch Inc
- Gladstone Salsa
- Gladstone Seafarers Centre
- Gladstone SES
- Gladstone Seventh-day Adventist Church
- Gladstone Spinner, Weavers and Fibre Worker
- Gladstone Springability Committee
- Gladstone Suicide Bereavement Support Group
- Gladstone Thistle Pipe Band Inc
- Gladstone Toastmasters
- Gladstone Ukuleles (Gukes)
- Gladstone Vintage & Classic Car Club Inc
- Home Church
- HopeLINK
- Inner Wheel Club of Port Curtis Inc
- inSight Tribe
- iPlay Playgroup
- Islamic Society of Gladstone
- Just Rock Gladstone
- Kareeba Scout Group
- Lifestyle Church
- Lifestyle Loud
- Little explorers Playgroup
- Marine Rescue Queensland Gladstone
- Meteors R/C Car Club
- Not For Prift HQ Ltd (trading as NFP House)
- Nhulundu Health
- Parent to Parent AssociationQLD Inc
- PIPA – Preterm Infants Association
- Port Curtis District Scouts
- Port City Christian Church
- Port Curtis Patchwork Group Inc
- Port Curtis Royal Arch
- QFES Rural Fire Service
- Queensland Country Women’s Association – Gladstone Branch
- Queensland Country Women's Association - Port Curtis Division Handcraft & Cultural Committee - Gladstone Area
- Quoin Island Turtle Rehabilitation Centre
- Quota Club of Gladstone Inc
- Revolution Youth
- Rotary Club - Gladstone Midday Inc
- Rotary Club - Gladstone Port Curtis
- Rotary Club of Gladstone Inc
- Rotary Club of Gladstone SUNRISE Inc
- Rotary International District 9570 Group 7
- Society for Growing Australian Plants Qld Region Inc.Gladstone (Native Plants Queensland)
- South End Progress Association
- South Gladstone Rotary Club
- Squeals on Wheels Playgroup
- St Martin's Lutheran Church
- St Peter's Playgroup
- Strong Communities
- Sukyo Mahikari
- Survivors of Suicide Gladstone
- The Mission to Seafarers - Gladstone Inc
- The Uniting Church in Australia - Gladstone Congregation
- Transformation Church
- Turtle Action Group
- Veils of Arabia Belly Dance
- Wargamers & Role-players of Gladstone
- Waterfront Artists
- Women Connecting Women
- Youth Academy - GPAC
- Zonta Club of Gladstone Inc
Sporting Groups
- Boxing Club (PCYC)
- Brothers Cricket Club
- Central Coast Car Club Gladstone Inc
- Central Football Club
- Central Queensland Veterans Cyclismo
- Central Soccer Club
- Clinton Football Club
- Clinton Park Sports Association
- CQ Minimoto
- CQ Target Sports
- CrossFit Gladstone
- Curtis Coast Cruisers Inc
- Curtis Coast Trail Riders Club Inc
- Giants Basketball Club
- Gladstone & District 4WD Club Inc.
- Gladstone & District Hockey Association Inc.
- Gladstone & District Rugby League Inc (and Juniors)
- Gladstone Amateurs Basketball Association
- Gladstone Amateurs Boxing Club
- Gladstone Athletic Club
- Gladstone Basketball Association
- Gladstone Bowls Club
- Gladstone Brothers Cricket Club
- Gladstone Clay Target Club
- Gladstone Croquet Club
- Gladstone Cycling Club
- Gladstone Darts Assoc Inc
- Gladstone District Dirtrider Club
- Gladstone District Pistol Club
- Gladstone Gladiators Swimming Club
- Gladstone Golf Club (including Veterans)
- Gladstone Groper Masters Swimming Club Inc
- Gladstone Gymnastics Club
- Gladstone Hash House Harriers
- Gladstone Horse Performance Club Inc.
- Gladstone Judo Club
- Gladstone Indoor Bowls
- Gladstone Junior Golf Club
- Gladstone Junior Tennis Assoc
- Gladstone Kart Club Inc
- Gladstone Martial Arts Academy
- Gladstone MTB (Mountain Bike) Club
- Gladstone Mudcrabs
- Gladstone Netball Association
- Gladstone Road Runners
- Gladstone Roller Derby Inc
- Gladstone Rugby Union Club
- Gladstone Softball
- Gladstone South Swimming Club
- Gladstone Suns AFLC
- Gladstone Swimming Club Inc
- Gladstone Tennis and Squash Association
- Gladstone Touch Association Inc
- Gladstone United Football Club
- Gladstone Volleyball
- Glen Cricket Club
- Harbour City BMX Club
- Meteors
Community-led Events
- Capricorn Film Festival
- Gladstone Eisteddfod Association Inc
- Gladstone Festival & Events Assoc Inc
- Gladstone Region Multicultural Week
- Gladstone Show Society
Parks
- Alf Larson/Lions Park
- ANZAC Park
- Apex Park
- Forest Springs Park
- Gladstone Tondoon Botanic Gardens
- Harmony Park
- Lions Park – Gladstone
- Little Creek Parklands
- Memorial Park
- Reg Tanna Park
- Daintree Reserve
Sport and Recreation
- Gladstone Harbour
- The Rounds Gladstone Trail
- Gladstone Aquatic Centre
- John Dahl Pool Complex
- Cassy Lives Skate Park
- Gladstone Skate Park
- Gladstone City Family, Fun & Fitness Area
- Central Park
- East Shores
- Palm Point
- Gallipoli Place
- Bulgwoyn Park
- Joe Joseph Park
- Gladstone Marina