Business
New Auckland
Employment and Education
 The main occupation categories for people aged 15 years and over in New Auckland are:
- 22.7% - Technicians and Trade Operators
- 14% - Professionals
- 12.1% - Labourers
- 11.5% - Machinery operators
- 11% - Community and personal service workers
Whilst Community and Personal Service Workers represent 11 per cent of the New Auckland community, this category has seen exponential growth of 84.3 per cent across the decade.
Minor increases have been observed in the categories of Professionals and Technicians and Trade workers of 6.5 per cent and 6.6 per cent respectively.
Clerical and administrative workers experienced the largest decrease at 9.4 per cent, or 29 people.
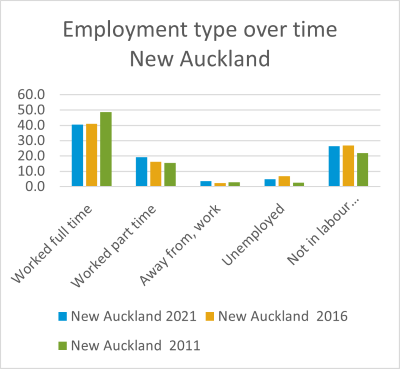
 The number of people of people that worked full time decreased by 95 people between 2011 and 2021. The percentage of the population working full time decreased over this period from 48.6 per cent in 2011 to 40.9 per cent in 2016 and 40.5 per cent in 2021. This equates to a decrease of 5.5 per cent decrease in the workforce working full time.
Over the same period the number of people that worked part time increased by 218 people, from 548 people in 2016 to 626 in 2016 and 766 in 2021. This equates to a 39.7 per cent increase in the proportion of the workforce working part time when comparing 2011 and 2021 data.
The unemployment rate has significantly increased in New Auckland between 2011 and 2021. In 2011 the unemployment rate was 2.6 per cent (91 people) compared to 6.8 per cent or 261 people in 2016, before reducing to 4.8 per cent or 190 people in 2021. The unemployment rate increased by 108 per cent between 2011 and 2021, which means the number of unemployed people increased by 99 people.
 There has been a 36.5 per cent increase in the percentage of the population not in the workforce between 2011 and 2021, the equivalent of 282 people. The number of people not in the workforce in 2021 and 2016 remained roughly static in 2021 and 2016, which was 1,057 and 1,029.
In 2021, the top five ranked industries were manufacturing at 15.6 per cent followed by retail trade at 10.9 per cent, in third place was Health and Social Assistance 10.6 per cent, while in fourth construction at 10.3 followed by transport, postal warehousing in fifth at 8.4 per cent.
 It is worth noting that those working in the health care and assistance has seen the largest increase across all industries. Making up 5.3 per cent of the workforce in 2011. 7.7 per cent in 2016 and 10.6 per cent in 2021, an increase of 111.7 per cent.
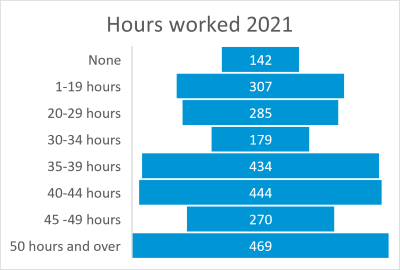
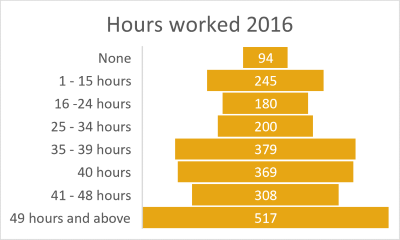
In 2021 63.3% of the workforce worked more than 35 hours week which is 2.7% increase from 2016.
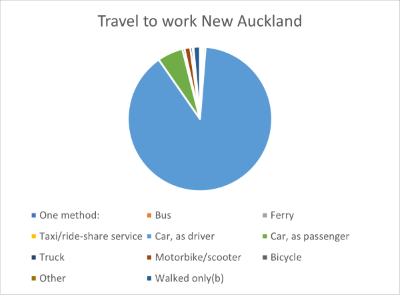
Data from the 2021 census shows 94.6 per cent of workers travel to their place of work by car, either as driver or passenger.
Considerations:
- There is a large proportion on people working over 35 hours per week. Consideration to be given around the accessibility and timing of events, activities and programs


