Business
New Auckland
Household Character
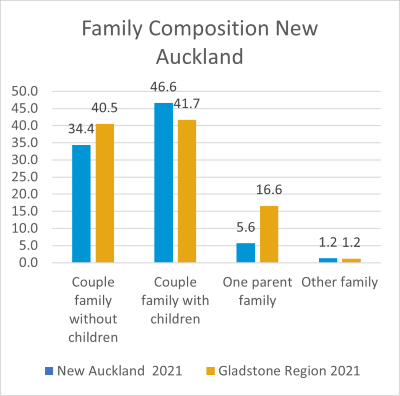
The communities of New Auckland have diverse household types with the main group being couples with children.
In 2021, the percentage of couple families with children was 46.6 per cent which is higher than the region at 41.7 per cent and the State 41.2 per cent.

The number of couple families with children was 607 in 2011, which was 49.7 per cent of families. While in 2016 the number of families in this category increased to 663 in 2016, which represented 49.8 per cent in of families. While in 2021 there were 636 couple families with children. The proportion of the population that are couple families with children has increased by 4.8 per cent between 2011 and 2021 which equates to a slight increase of 29 people.
The number of couple families without children has fluctuated between 2011 and 2021, being 415 (34 per cent of families), 470 (353.3 per cent of families) in 2016 and 469 or 34.4 per cent of families in 2021. This equates to an increase of 54 couple families without children between 2011 and 2021.
There number of one parent families has decreased significantly between 2011 and 2021, reducing by 57.2 per cent.
One parent family represented 14.7 per cent of families in 2011, 14 per cent in 2016 and 5.6 per cent in 2021. The number of one parent families was 180 in 2011, 186 in 2016 and 77 in 2021. This equates to and overall reduction of 103 one parent families living in New Auckland between 2011 and 2021.
The number of families in New Auckland increased by 147 between 2021 and 2011.
There are 1,561 people in a registered marriage in New Auckland, which is 44.7 per cent of the population, which 2.49 per cent higher than the region at 43.6 per cent.
While higher than the region, the number of people in a registered marriage has fluctuated over time being 1,482 people (47.8 per cent of population) in 2011, increasing to 1,581 people or 48.5 per cent of the population in 2016, before decreasing slightly to 1,561 people of 44.7 per cent of the population. Between 2011 and 2021 there has been an increase of 221 people in a registered marriage, people in this category make up 3.1 per cent less of the population in 2021 compared to 2011.
The percentage of the population at are not married has also fluctuated over time. Making up 36 per cent of the New Auckland community in 2011, compared to 33.6 per cent in 2016 and 28.7 per cent in 2021. This means the proportion of the community that is not married was 2.7 per cent higher or an additional 234 people in 2021 compared to 2011.
The number of people in a de-facto marriage increased from 500 in 2011 to 583 in 2016, staying roughly static in 2021 at 581. This means that the proportion of people in a de-facto marriage increase by 16.2 per cent between 2011 and 2021.
Family composition
| New Auckland | Gladstone Region | Queensland | |||||||||||
|---|---|---|---|---|---|---|---|---|---|---|---|---|---|
|
|
2021 |
% pop |
2016 |
% pop |
2011 |
% pop |
% Change 2011 - 2021 |
% Change 2016 - 2021 |
% Change 2011 - 2016 |
2021 pop |
% pop |
2021 pop |
% pop |
|
Couple family without children |
469 |
34.4 |
470 |
35.3 |
415 |
34 |
13.0% |
-0.2% |
13.3% |
6,829 |
40.5% |
551,069 |
40.3% |
|
Couple family with children |
636 |
46.6 |
663 |
49.8 |
607 |
49.7 |
4.8% |
-4.1% |
9.2% |
7,021 |
41.7% |
563,327 |
41.2% |
|
One parent family |
77 |
5.6 |
186 |
14 |
180 |
14.7 |
-57.2% |
-58.6% |
3.3% |
2,798 |
16.6% |
124,174 |
9.1% |
|
Other family |
17 |
1.2 |
3 |
0.2 |
19 |
1.6 |
-10.5% |
466.7% |
-84.2% |
202 |
1.2% |
46707 |
3.4% |
source ABS 2022, 2016, 2011
Social Marital Status
|
New Auckland |
Gladstone Region |
||||||||||
|---|---|---|---|---|---|---|---|---|---|---|---|
|
|
2021 |
% pop |
2016 |
% pop |
2011 |
% pop |
% Change 2011 - 2021 |
% Change 2016 - 2021 |
% Change 2011 - 2016 |
2021 |
% pop |
|
Registered marriage |
1,561 |
44.7 |
1,581 |
48.5 |
1,482 |
47.8 |
5.3% |
-1.3% |
6.7% |
20,253 |
43.6% |
|
De facto marriage |
581 |
16.6 |
583 |
17.9 |
500 |
16.1 |
16.2% |
-0.3% |
16.6% |
6,476 |
14.8% |
|
Not married |
1,350 |
38.7 |
1,095 |
33.6 |
1,116 |
36 |
21.0% |
23.3% |
-1.9% |
16,998 |
38.8% |
source ABS 2022, 2016, 2011


