Business
Mount Larcom
Age Profile
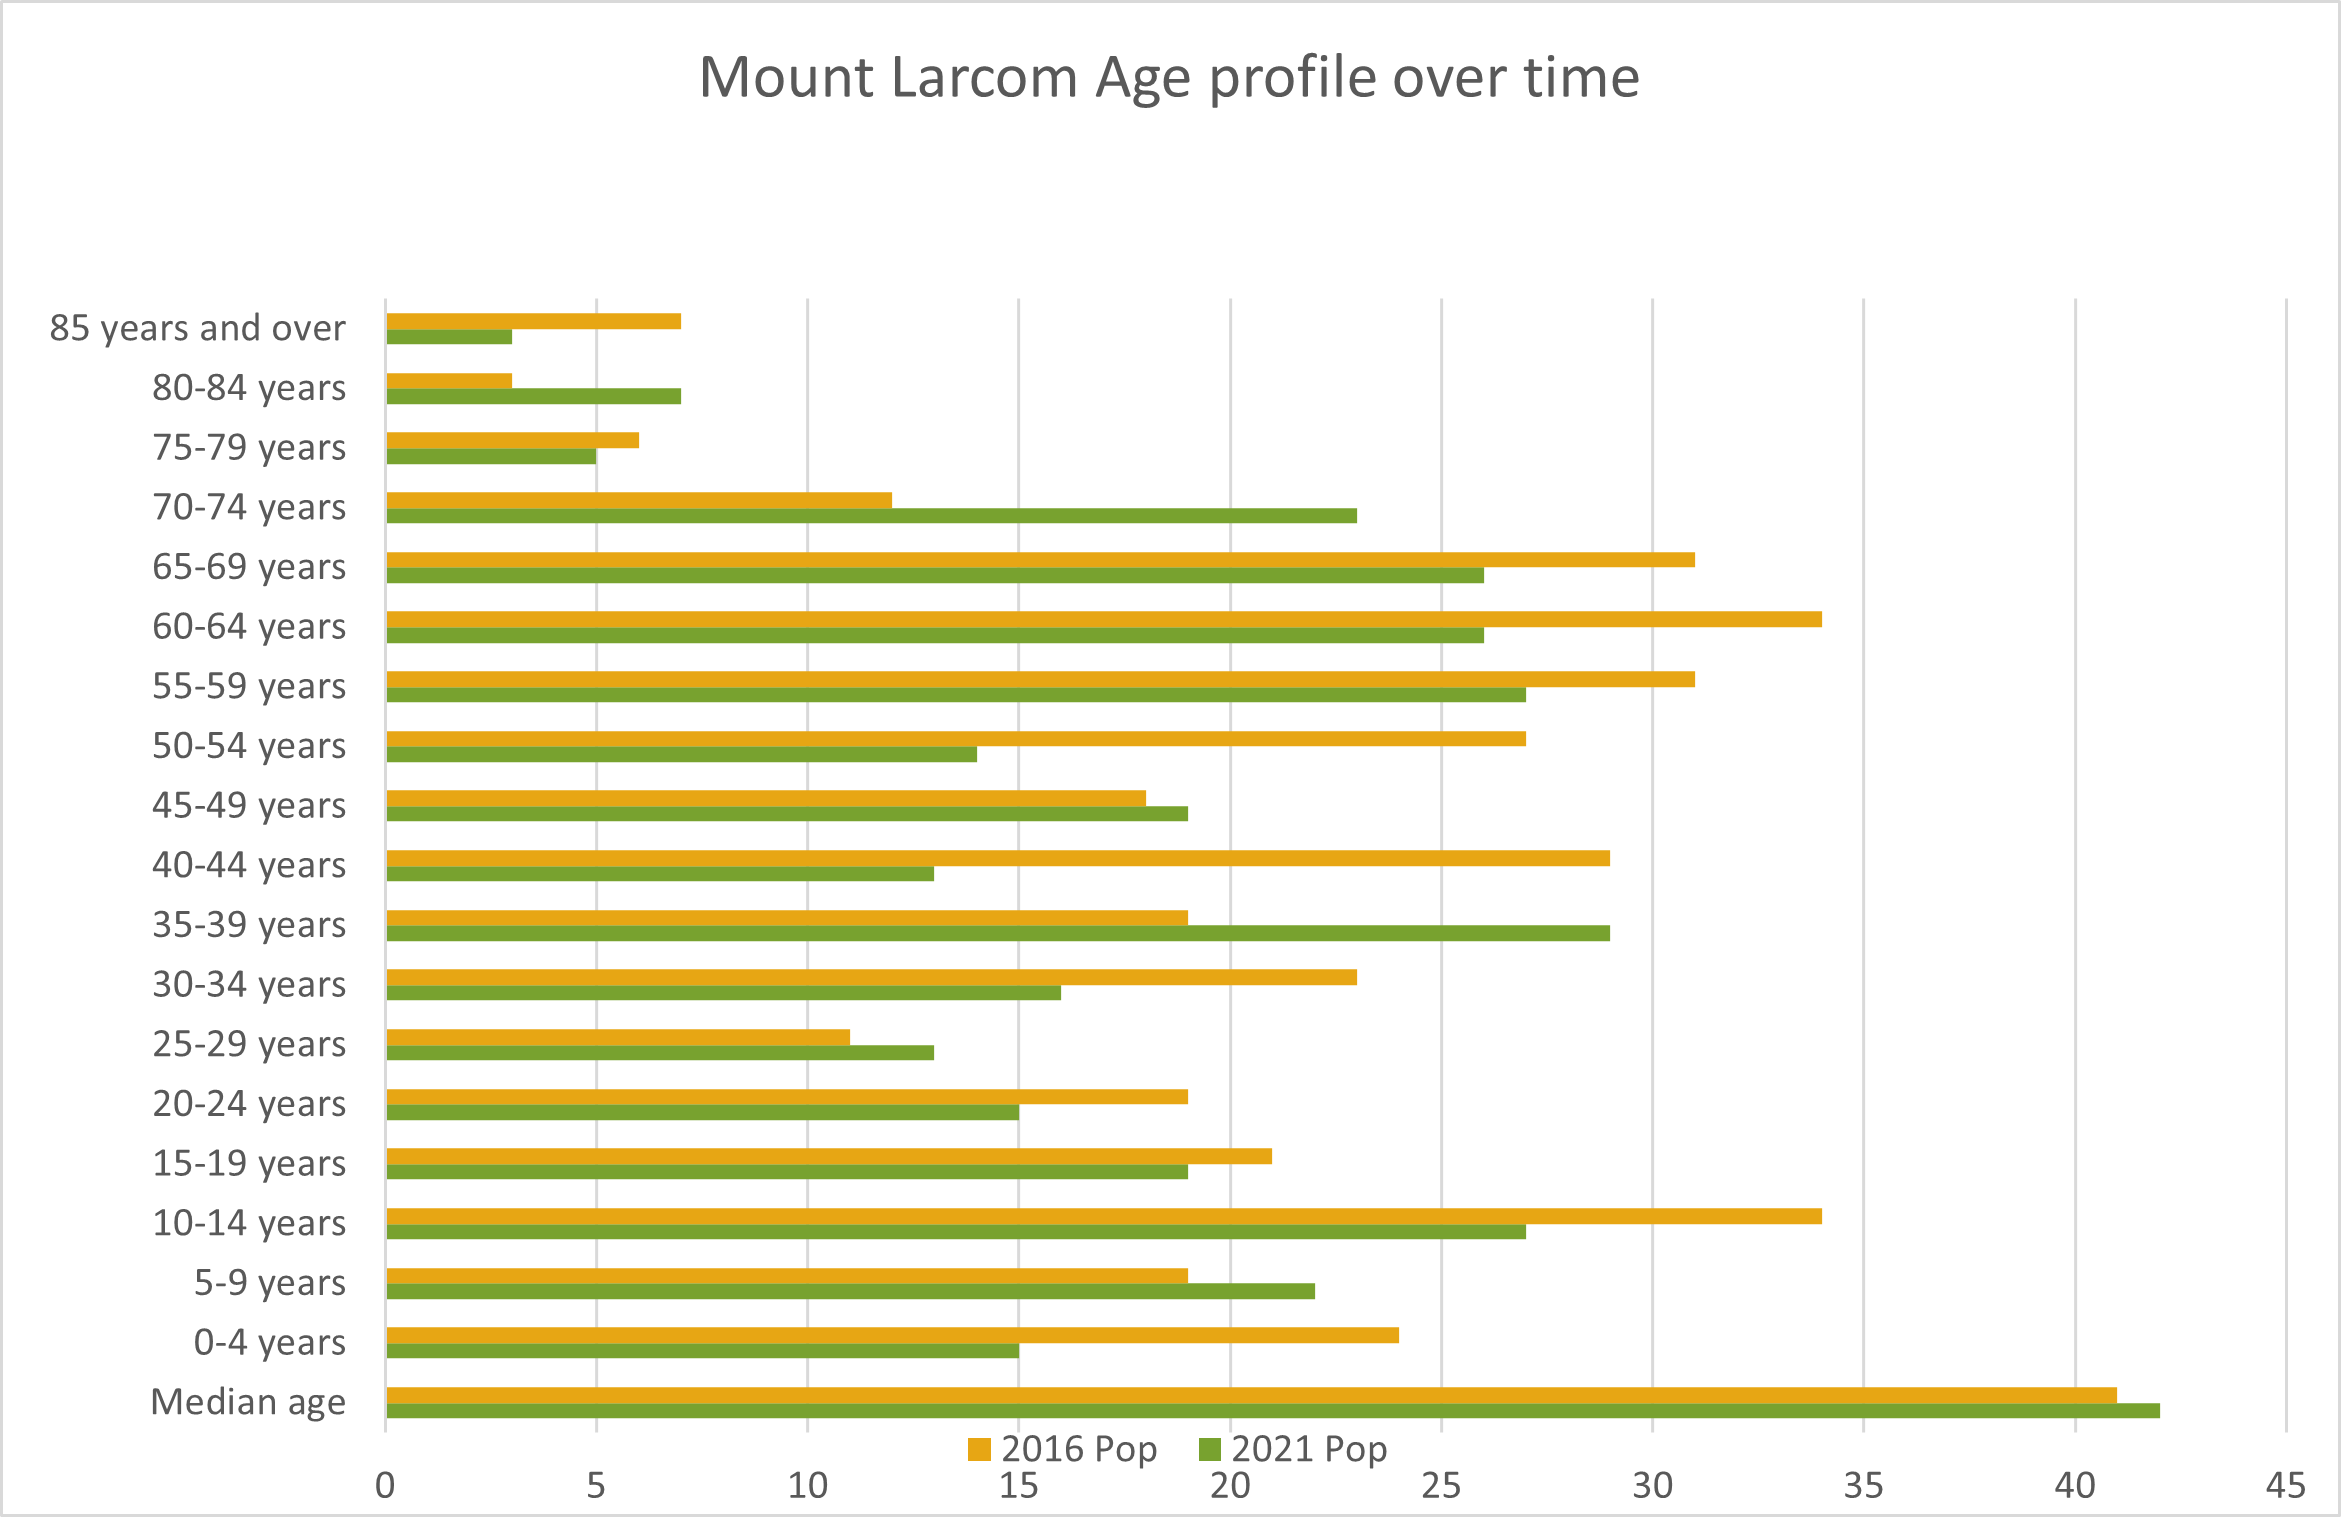
In 2021 the communities of Mount Larcom had a population of 319, which is a decrease of 46 people since 2016.
In 2021, the median age for Mount Larcom was 42 which is slightly higher than the Gladstone Region at 38 and the Queensland median age of 38.
Since 2016 the median age of the Mount Larcom community has increased from 41 to 42 years of age.
The Mount Larcom community is diverse across age groups with people living in the area until their senior years.
Across the decade there have been changes in all age categories, with the most notable growth in the 80-84 year category, which whilst only four people, represents a 133 per cent increase.
The largest decline in population was the 40-44 age group, with a 55.2 per cent decrease or 16 people.
Other noticeable changes were as follows:
- 35-39 years - increase of 52.6 per cent
- 50-54 years - decrease of 48.1 per cent
- 70-74 years - increase of 91.7 per cent
When compared to the Gladstone Region and State there are some noticeable differences, with Mount Larcom having a higher percentage of the population aged 55-74 compared to the region and State and a lower percentage of their population aged 75-79, 40-54, 15-34 and 0-4 years old.

In 2021, the age groups that differ most to the Gladstone Region are:
- There has been a decrease of babies and pre-schoolers by 37.5 per cent or nine people between 2016 and 2021, moving the percentage of young people in this age bracket 30 per cent less than the region.
- There is a decrease in older workers, empty nesters and retirees as a percentage of the population between 2016 and 2021, with a decrease of 47 people.
- Over the same period there was an increase of seniors aged 70-84 that make up the population in 2021, with a 66 per cent change or 14 people compared to 2016.
When planning services, consideration should be given to the level of service required for Mount Larcom’s declining population.
A particular focus needs to be on access to services and programs for seniors in the community, which has potential to lead to a higher proportion elderly community member aged 85 than the region over the next five years.
Consideration also needs to be given to the types of sport and recreation opportunities needed for the Mount Larcom community given the reduction in younger people living in the community.

source ABS 2022, 2016
|
Age |
Mount Larcom |
Gladstone Region |
Queensland |
||||||
|---|---|---|---|---|---|---|---|---|---|
|
|
2021 Pop |
% pop |
2016 Pop |
% pop |
% Change 2021 - 2016 |
2021 Pop |
% pop |
2021 Pop |
% pop |
|
Median age |
42 |
N/A |
41 |
N/A |
N/A |
38 |
N/A |
38 |
N/A |
|
0-4 years |
15 |
4.7 |
24 |
6.5 |
-37.5% |
4,049 |
6.4 |
292,452 |
5.7 |
|
5-9 years |
22 |
6.9 |
19 |
5.2 |
15.8% |
4,686 |
7.4 |
329,311 |
6.4 |
|
10-14 years |
27 |
8.46 |
34 |
9.2 |
-20.6% |
4,913 |
7.7 |
342,560 |
6.6 |
|
15-19 years |
19 |
5.96 |
21 |
5.7 |
-9.5% |
4,001 |
6.3 |
313,506 |
6.1 |
|
20-24 years |
15 |
4.7 |
19 |
5.2 |
-21.1% |
3,159 |
5 |
323,739 |
6.3 |
|
25-29 years |
13 |
4.1 |
11 |
3 |
18.2% |
3,766 |
5.9 |
347,687 |
6.7 |
|
30-34 years |
16 |
5 |
23 |
6.3 |
-30.4% |
4,066 |
6.4 |
354,033 |
6.9 |
|
35-39 years |
29 |
9.1 |
19 |
5.2 |
52.6% |
4,280 |
6.7 |
357,120 |
6.9 |
|
40-44 years |
13 |
4.1 |
29 |
7.9 |
-55.2% |
4,069 |
6.4 |
330,692 |
6.4 |
|
45-49 years |
19 |
6 |
18 |
4.9 |
5.6% |
4,518 |
7.1 |
340,287 |
6.6 |
|
50-54 years |
14 |
4.4 |
27 |
7.3 |
-48.1% |
4,546 |
7.2 |
333,843 |
6.5 |
|
55-59 years |
27 |
8.5 |
31 |
8.4 |
-12.9% |
4,524 |
7.1 |
316,378 |
6.1 |
|
60-64 years |
26 |
8.2 |
34 |
9.2 |
-23.5% |
4,154 |
6.5 |
298,919 |
5.8 |
|
65-69 years |
26 |
8.2 |
31 |
8.4 |
-16.1% |
3,190 |
5 |
264,515 |
5.1 |
|
70-74 years |
23 |
7.2 |
12 |
3.3 |
91.7% |
2,532 |
4 |
238,952 |
4.6 |
|
75-79 years |
5 |
1.6 |
6 |
1.6 |
-16.7% |
1,507 |
2.4 |
168,385 |
3.3 |
|
80-84 years |
7 |
2.2 |
3 |
0.8 |
133.3% |
886 |
1.4 |
106,611 |
2.1 |
|
85 years and over |
3 |
0.9 |
7 |
1.9 |
-57.1% |
679 |
1.1 |
97,140 |
1.9 |
|
Group |
Age |
Mount Larcom |
Gladstone Region |
|||||
|---|---|---|---|---|---|---|---|---|
|
|
|
2021 |
% pop |
2016 |
% pop |
% Change 2016-2021 |
2021 |
% pop |
|
Babies and pre-schoolers |
0-4 yrs |
15 |
4.7 |
24 |
6.5 |
-37.5% |
4,049 |
6.4% |
|
Primary and secondary schoolers |
5-19 yrs |
68 |
21.3 |
74 |
20.1 |
-8.1% |
13,600 |
28.8% |
|
Tertiary education and independence |
20-24 yrs |
15 |
4.7 |
19 |
5.2 |
-21.1% |
3,159 |
5.0% |
|
Young workforce |
25-29 yrs |
13 |
4.1 |
11 |
3 |
18.2% |
3,766 |
5.9% |
|
Parents and home builders |
30-49yrs |
77 |
24.1 |
89 |
24.2 |
-13.5% |
16,933 |
26.6% |
|
Older workers and retirees |
50-59 yrs |
41 |
12.9 |
58 |
15.8 |
-29.3% |
9,070 |
14.3% |
|
Empty nesters and retirees |
60-69 yrs |
52 |
16.3 |
65 |
17.7 |
-20.0% |
7,344 |
13.6% |
|
Seniors |
70-84 yrs |
35 |
11 |
21 |
5.7 |
66.7% |
4,925 |
7.8% |
|
Elderly aged |
85+ |
3 |
0.9 |
7 |
1.9 |
-57.1% |
679 |
1.1% |
Service group breakdown compared to the Region, source ABS 2022, 2016


